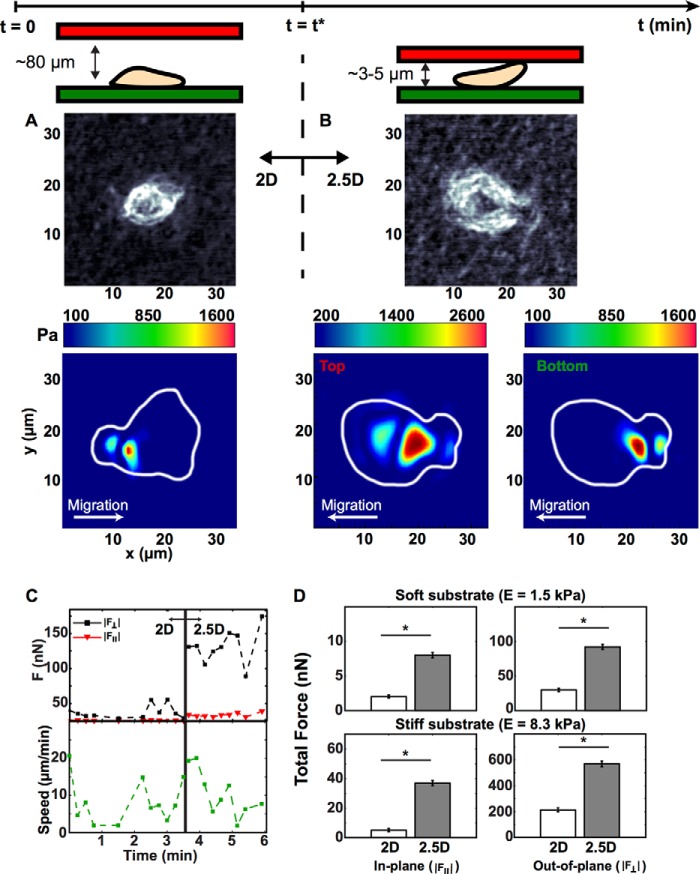
FIGURE 3.
A and B, phase-contrast images of a neutrophil and its associated cell traction profiles in a two-dimensional system (A) and a 2.5D system (B). The color contour map displays the magnitude of the three-dimensional traction vector. C, dynamic out-of-plane (black) and in-plane (red) total forces and cell speed (green) for a neutrophil during dimensional switch from a two-dimensional to a 2.5D system. D, total out-of-plane (right column) and in-plane (left column) force components in our two-dimensional (white) and 2.5D (gray) systems on soft and stiff substrates (top and bottom rows). Quantitative data reflect the median and S.E. (*, p < 0.01 versus two-dimensional, Kruskal-Wallis test; n > 100).

