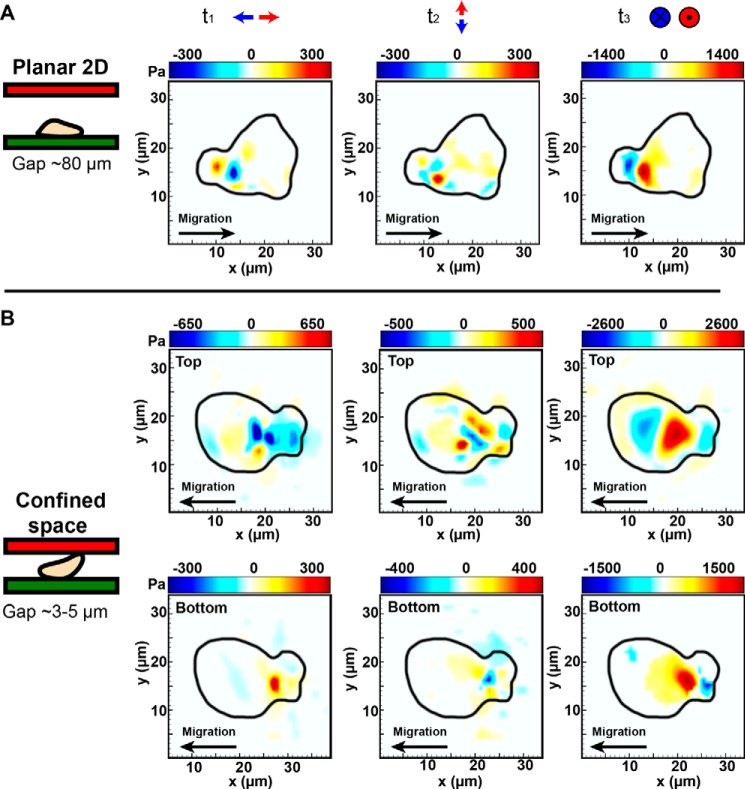
FIGURE 4.
Decomposition of traction forces shown in Fig. 3 (A and B) into their t1,t2 (in-plane) and t3 (out-of-plane) traction components in two dimensions (A) and 2.5D (B). All of the contour maps and color bars represent tractions in Pa. Positive and negative t3 traction are defined using the local, positive outward normal vector for each upper and lower gel as illustrated in Fig. 2B. Comparison of the two-dimensional and 2.5D traction profiles reveals similar spatiotemporal patterns with significant traction generation in the uropod of the cell. Traction profiles in 2.5D show a significant contribution from the central, nuclear region of the neutrophil against the top surface.

