
FIGURE 8.
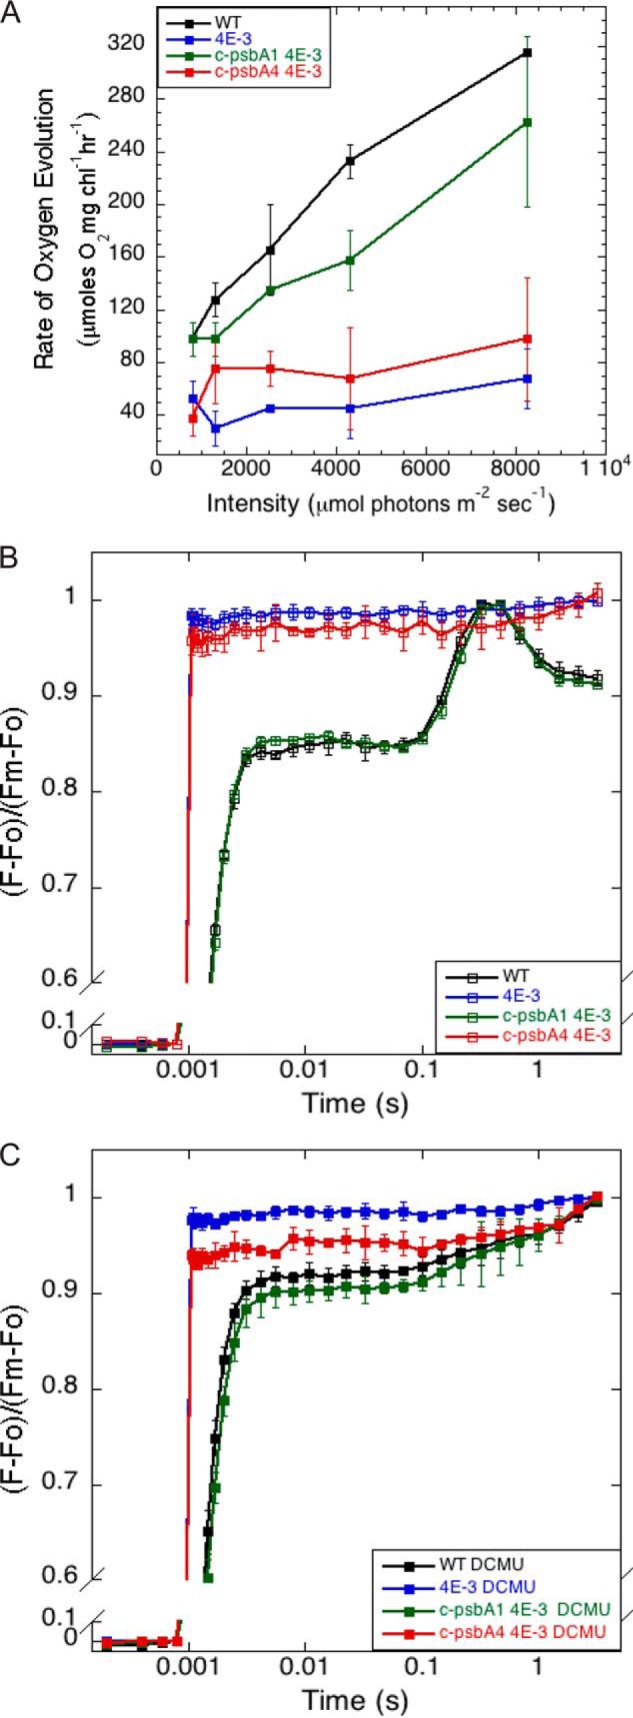
PSII activities in Synechocystis WT, 4E-3, c-psbA1 4E-3, and c-psbA4 4E-3 cells. A, PSII-mediated oxygen evolution, samples at 10 μg/ml Chl. n = 3; error bars represent S.D. B, fluorescence induction without DCMU (open symbols). C, fluorescence induction with DCMU (closed symbols), samples at 7 μg/ml Chl. n = 3; error bars represent S.D.