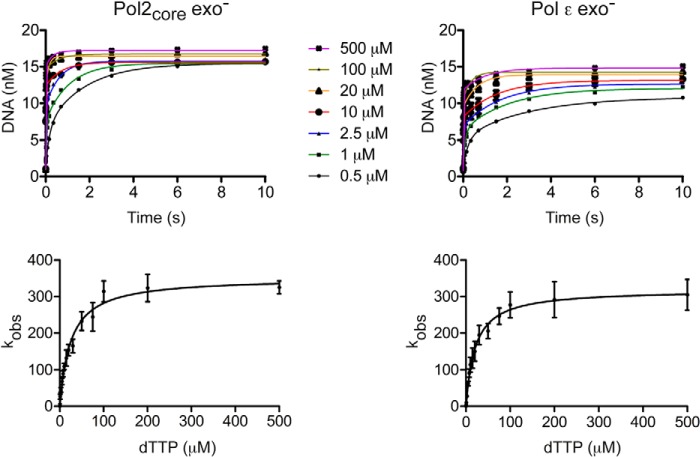
FIGURE 3.
Maximum rate of dTTP incorporation. Top, the amount of product formed was plotted against time using a double-exponential equation with a fast phase and a slow phase for each dTTP concentration. In the resulting plot, seven selected dTTP concentrations are shown as examples. Bottom, the observed rate constants for the fast phase were plotted as a function of dTTP concentration and fit to a hyperbola. Error bars, S.E. obtained from three independent experiments. The maximum rate constants obtained were kpol ∼352 s−1 and KddTTP ∼25 μm for Pol2 exo− and kpol ∼319 s−1 and KddTTP ∼21 μm for Pol ϵ exo−.

