Figure 3.
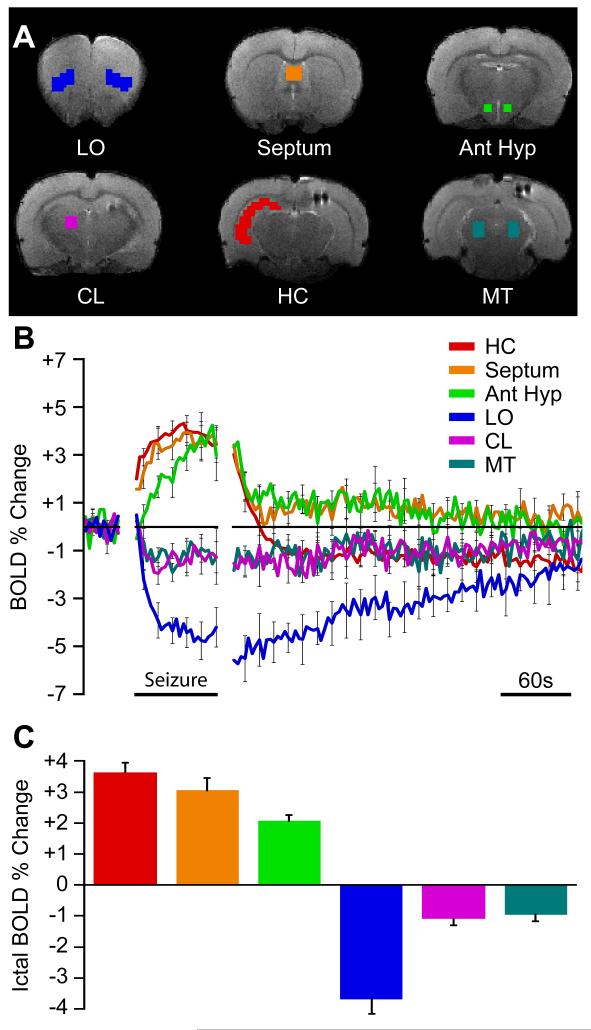
BOLD region of interest (ROI) time courses reveal increases and decreases during seizures and eventual return to baseline.
(A) Example regions of interest on anatomical brain images.
(B) Mean ROI time courses (±SEM) for data 30 seconds prior to seizure onset, seizure timecourse scaled to mean seizure duration, and unscaled postictal timecourse aligned to seizure end.
(C) Mean ictal BOLD change is increased in limbic and sleep promoting regions and decreased in cortical and arousal regions. Error bars are SEM. All changes during seizures were significantly different from baseline (1-sample t-tests Holm-Bonferroni corrected, P < 0.05). Data are from same animals and seizures as in Figure 2. Ant Hyp, anterior hypothalamus; HC, hippocampus; LO, lateral orbital frontal cortex; CL, central lateral (intralaminar) thalamus; MT, midbrain tegmentum; Septum, lateral septal nuclei. See also Figure S1

