Figure 6.
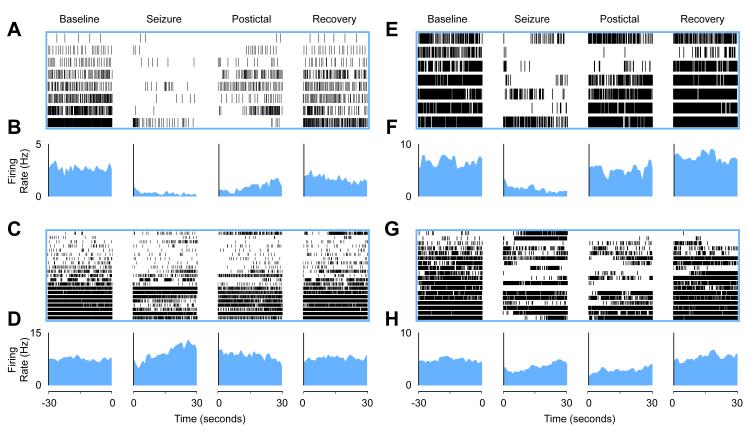
Cholinergic neurons in PPT and basal forebrain decrease firing during partial seizures while firing of non-cholinergic nearby neurons is mixed.
(A and B) Partial seizures suppressed firing in PPT cholinergic neurons during seizures.
(A) Raster plot (8 cells from 8 animals) and (B) mean firing rate histogram data.
(C and D) PPT non-cholinergic neurons have a variable firing rate during seizures. Mean firing rate during seizures. (C) Raster (21 cells from 19 animals) and (D) mean firing rate histogram data.
(E and F) Partial seizures suppressed firing in basal forebrain cholinergic neurons during seizures. (E) Raster (7 cells from 6 animals) and (F) mean firing rate histogram data.
(G and H) BF non-cholinergic neurons have a variable firing rate during seizures. (G) Raster (18 cells from 12 animals) and (H) mean firing rate histogram data. Although selected 30 second segments are displayed here, the entire timecourses of mean firing are shown in Figure S7. Statistics were performed on the entire seizure period vs. baseline for all experiments. Baseline is 30 seconds prior to seizure onset. Seizure is the first 30 seconds following seizure onset. Postictal is the first 30 seconds following seizure end. Recovery is the last 30 seconds before either the animal was re-anesthetized or the neuron was labeled by the juxtacellular method. Neurons in raster plots (A, C, E, and G) are ordered based on baseline firing rate for visualization. Firing rates (B, D, F, H) are binned by 1 second. See also Figures S2, S3, S4, S5, S6, and S7.

