
Figure 2.
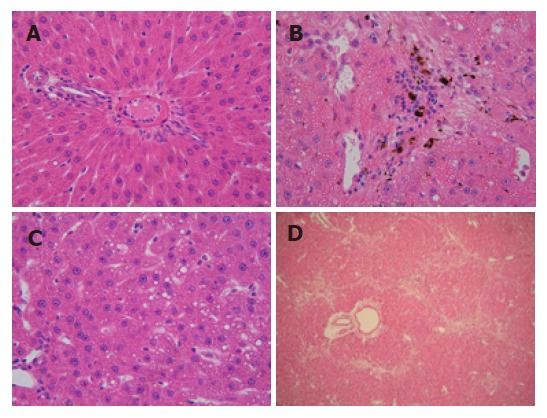
Liver histopathology of DMN-treated rats (HE). A: Control group, no marked pathological changes (× 400); B: Group model A, hemorrhagic necrosis with foci of lymphomonocytic infiltration around fibrosis tissue can be seen (× 400); C: Group model B, fat accumulated in numerous liver cells (× 400); D: Group model B, quantities of fiber deposited and linked with each other (× 400).