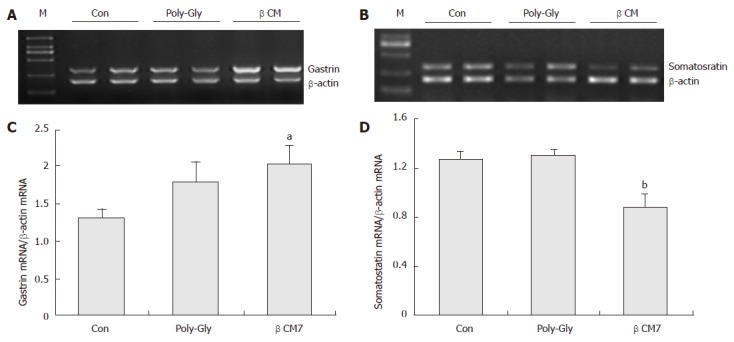
Figure 1.

Effect of beta-casomorphin-7 on gastrin and somatostatin mRNA expression by RT-PCR. (A) and (B): graphs of RT-PCR analysis. (C) and (D): densitometric analysis of somatostatin and gastrin signals over beta-actin signals. The vertical lines indicate the mean ± SE of three different experiments. aP < 0.05 vs control group, bP < 0.01 vs control group.
