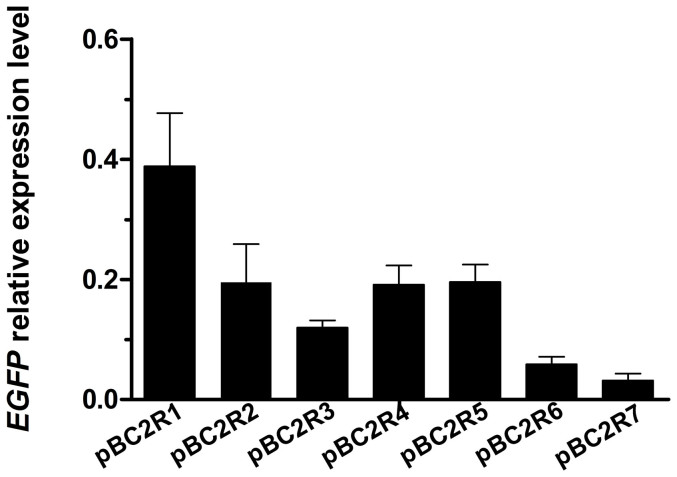
Figure 4. Transcriptional level of EGFP in different integration sites.
The inverse PCR showed that the PB integration sites were different in the seven pBC2R transgenic strains (Supplementary Table S3). The EGFP mRNA levels differed among these strains due to position effects from the host chromatin. Data are presented as the mean ± SD of three separate experiments performed in triplicate.

