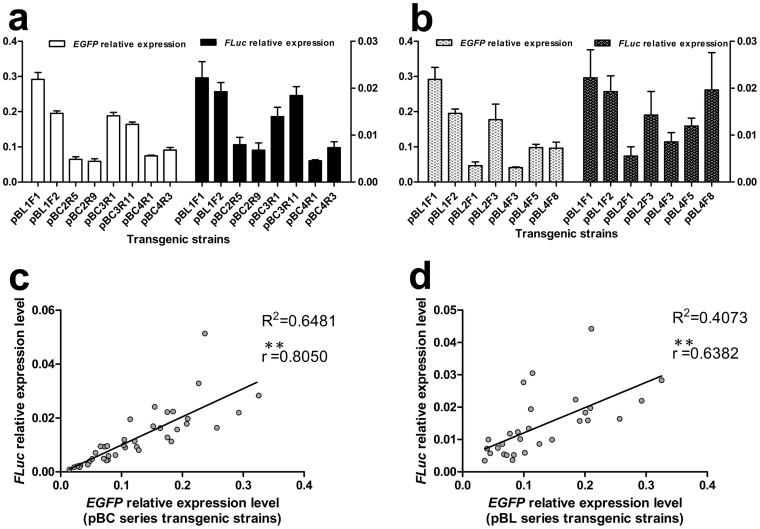
Figure 5. Correlation analysis between the marker (EGFP) and target (FLuc) genes at the transcriptional level.
(a, c) Transcription pattern comparison of EGFP and FLuc in the pBC (including pBL1F) series transgenic silkworms. A significant correlation was revealed between the EGFP and FLuc expression levels with the two expression frames assembled in close proximity. (b, d) However, the correlation between EGFP and FLuc in the pBL series transgenic silkworms was relatively lower; the Ser 1 promoters in front of FLuc were different (Fig. 2a), which affected the transcriptional level of FLuc. The qRT-PCR data are shown as the mean ± SD of three separate experiments performed in triplicate. **P < 0.01.

