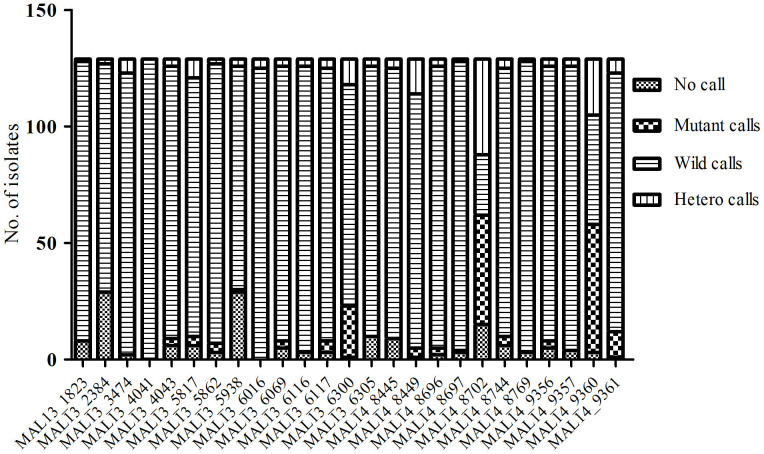
Figure 1. The call rate in each SNP in 129 isolates assayed.
48 samples were pre-ACT samples collected between period (1995–2003), 10 were collected in the post ACT period during transition period (2005–2008) and 71 were from the 2013–2014 in vivo efficacy clinical trial study. The call rates for each SNP (x-axis) in all 129 isolates analyzed is shown.

