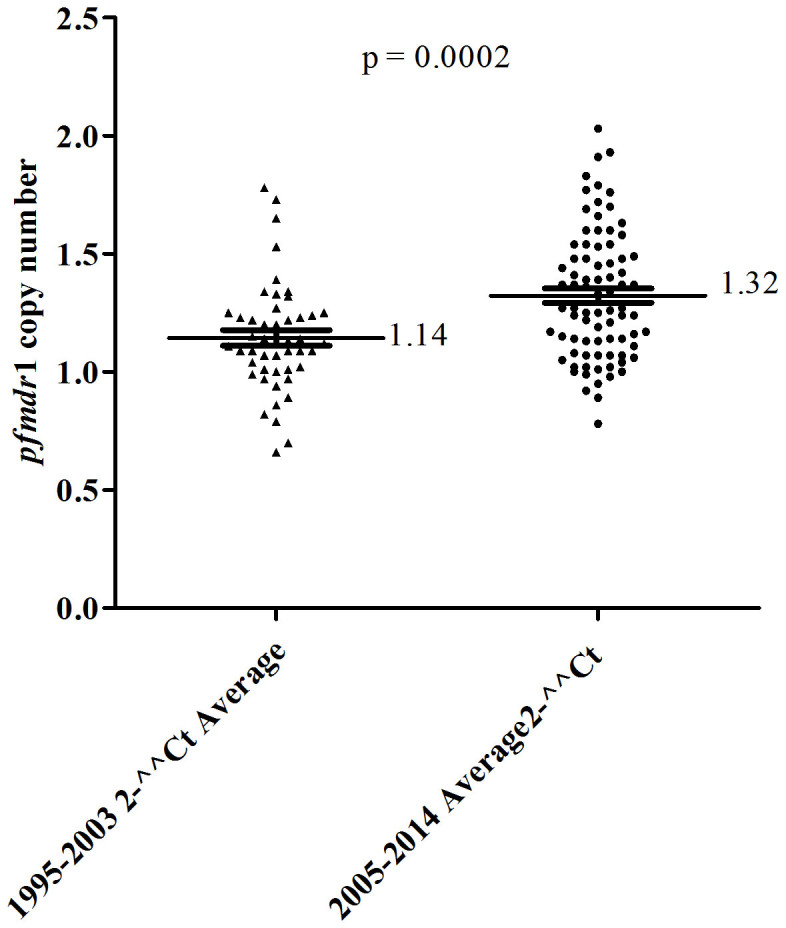
Figure 2. Comparison of the distribution of pfmdr1 copy number between pre- and post-ACTs periods.

Data showing the mean distribution of 48 samples pfmdr1copy number for pre-ACTs samples (1.14) and 71 post-ACT samples (1.32). There was statistical significant difference of pfmdr1 gene copy numbers between the two periods based on the t-test (p = 0.0002).
