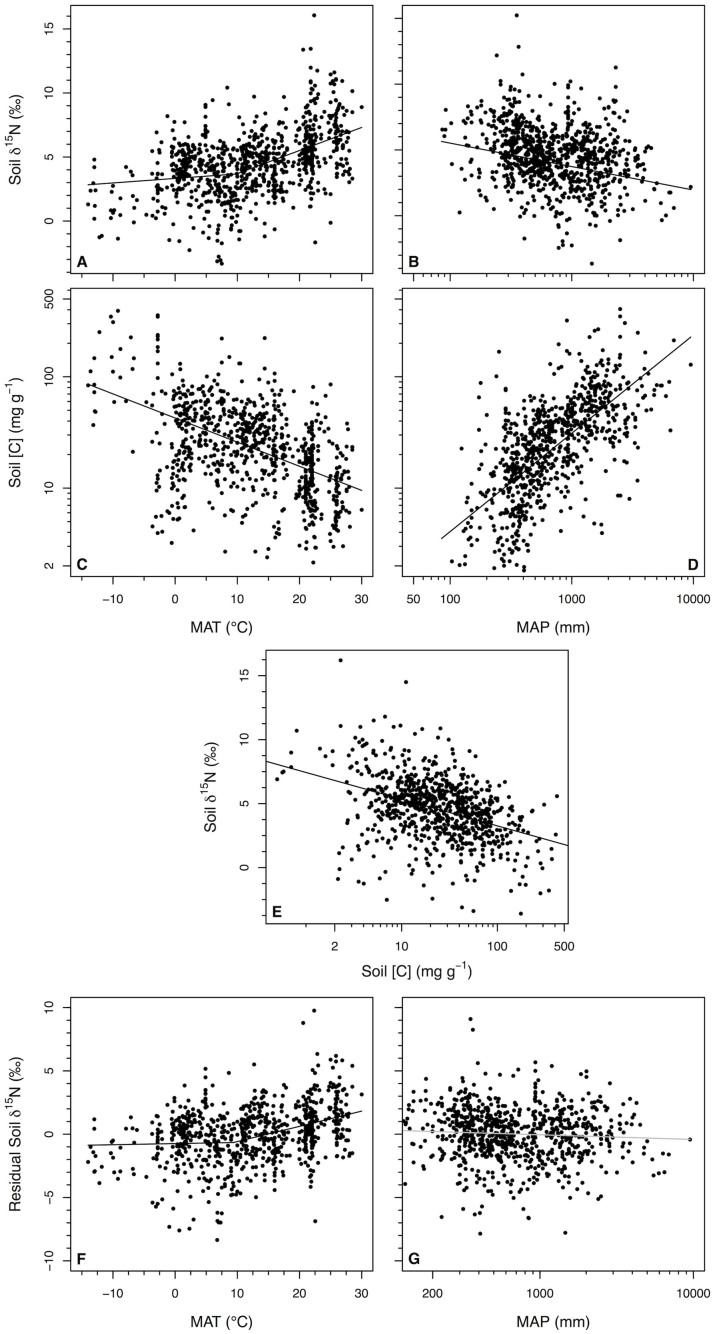
Figure 3. Relationships among climate and soil parameters.
Relationships between mean annual temperature (MAT) and mean annual precipitation (MAP) and (A,B) soil δ15N (n = 910) and (C,D) soil [C] of surface soils (n = 828). Each point represents values for all samples averaged per 0.1° latitude and longitude. The relationship between soil [C] and soil δ15N is shown in panel (E) (n = 828). After accounting for the variation in soil δ15N explained by soil [C] (n = 828), the residual variation in soil δ15N is shown vs. (F) MAT and (G) MAP (n = 828). Gray regression line is not significant at P > 0.05. Values displayed in relationships with MAT and MAP were corrected for variation that could be explained by the other climate variable and soil depth.

