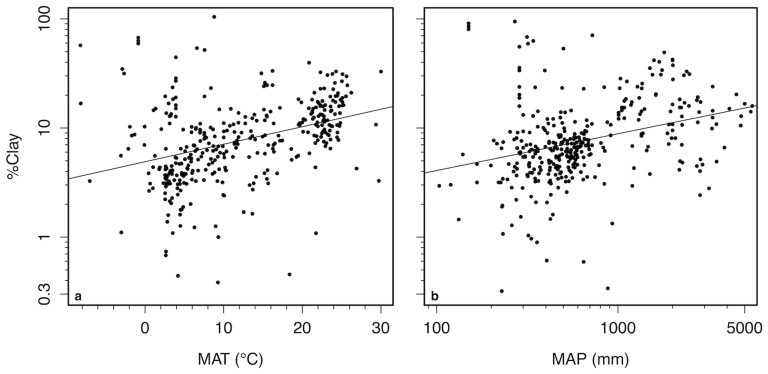
Figure 6. Patterns of soil clay concentrations with climate.
Relationships between (A) mean annual temperature (MAT) and (B) mean annual precipitation (MAP) vs. clay concentrations of surface mineral soils. log (%Clay) = −0.84 + 0.016 × MAT + 0.55 × log(MAP); r2 = 0.47, P < 0.001, n = 359. All points represent soil values averaged to 0.1° latitude and longitude.

