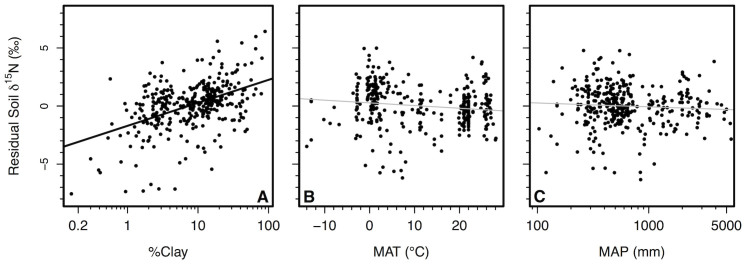
Figure 7. Lack of relationship between climate and soil δ15N after accounting for variation in clay concentrations.

Relationship between (A) clay concentrations in soil and residual soil δ15N after accounting for the relationship between soil δ15N and soil [C] (y = 1.71 + 2.01 × log(x), r2 = 0.22, P < 0.001; n = 355). Also shown are relationships between (B) mean annual temperature (MAT), (C) mean annual precipitation (MAP) and residual soil δ15N after accounting for variation in soil [C], clay concentrations, and soil depth. Non-significant relationships are shown in gray. All points represent soil values averaged to 0.1° latitude and longitude.
