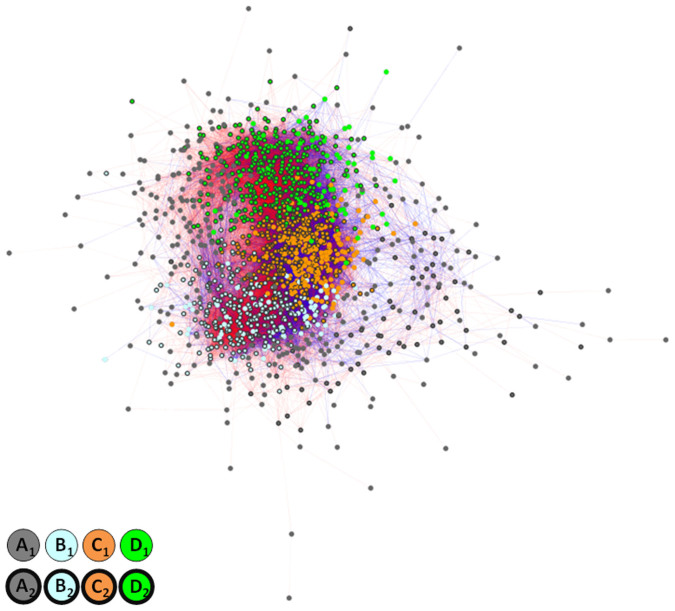
Figure 1. Transcriptional network of the filtered transcription factors.
All the interactions satisfy two criteria, coefficient of determination r2 > 0.7 and the slope ratio <0.15. Red indicates promotive interaction; blue indicates inhibitory interaction. The network was drawn with Cytoscape33 using a force-directed layout. TFs are coloured according to their assigned classes (lower left corner).

