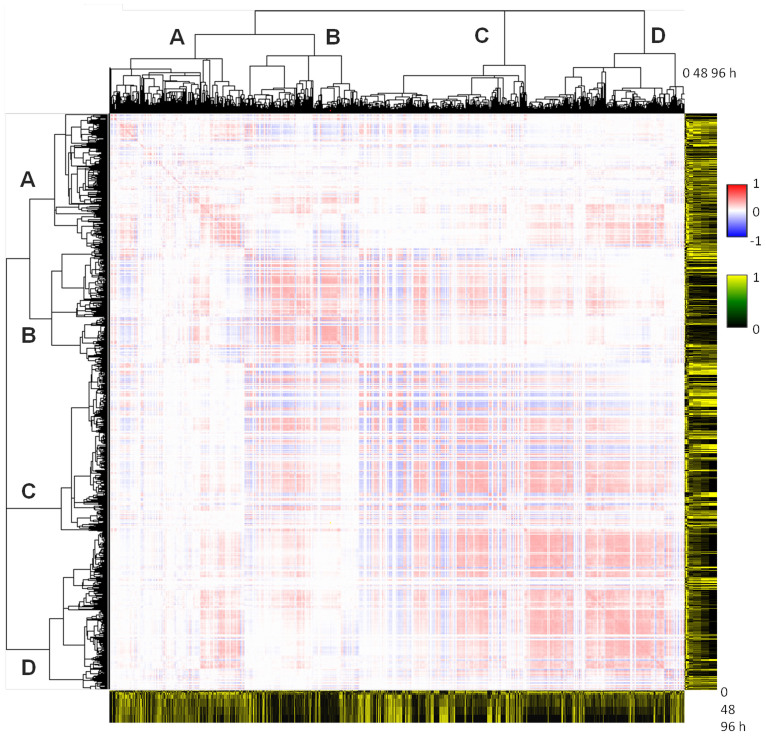
Figure 2. Goodness-of-fit matrices for the 1,619 filtered TFs in the transcriptional network.
Each element (i, j) of a matrix indicates the goodness-of-fit, measured by the coefficient of determination r2, by the depth of the colour. Red indicates bij > 0, where bij is the slope coefficient13 between the temporal expression profiles of i-th and j-th TF, suggesting promotive regulation; blue indicates bij < 0, suggesting inhibitory regulation. Letters on the dendrograms indicate the branch from which the TFs in the corresponding cluster split off. The heat-maps (right and below the matrices) show the temporal expression profiles of the TFs.

