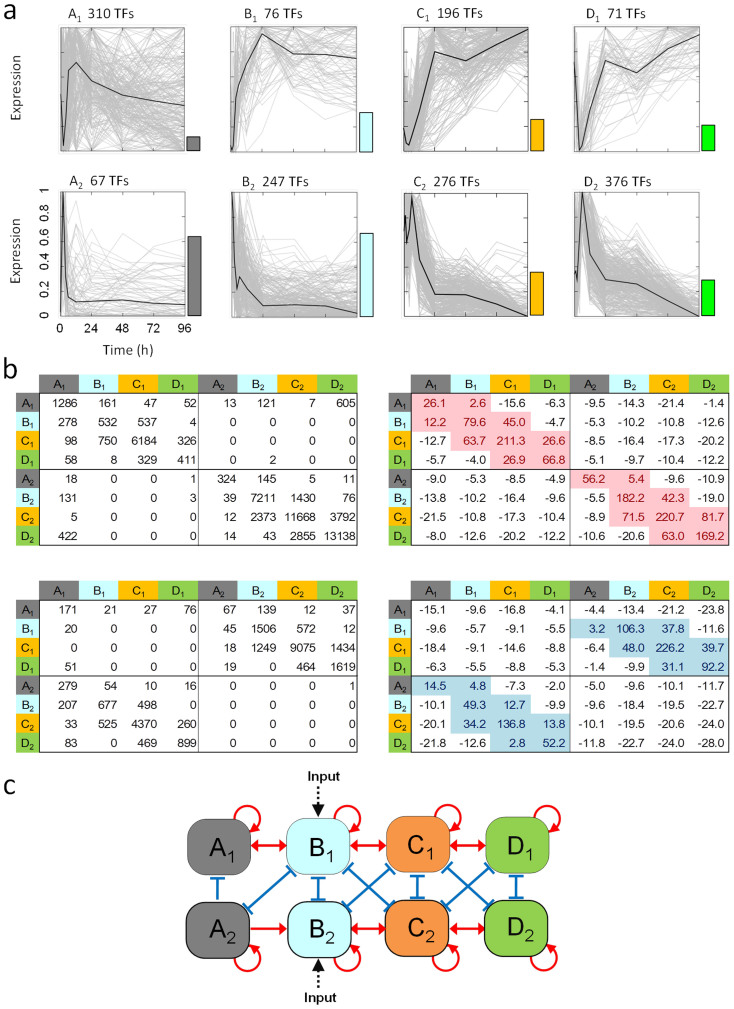
Figure 3. Identification of a system-wide transcriptional network structure.
(a) Normalized temporal expression profiles of TFs in eight classes. Grey lines indicate the temporal profiles of the TF; black lines indicate the representative profile for each class defined as a series of medians. The length of the bar adjacent to each graph indicates the calculated similarity ratio between the unit step function and the representative profile (see Supplementary Fig. S4). The number of TFs assigned to each class is shown above each of the graphs. (b) Distributions of identified interactions between the eight TF classes. The two panels on the left show the numbers of identified interactions between the TFs in the corresponding classes; the upper and lower panel show the numbers of promotive and inhibitory interactions, respectively. The two panels on the right show the Z-scores based on the test statistic in the two-sample test for equality of proportions (see Methods for details); the upper and lower panels show the Z-scores for the promotive and inhibitory interactions, respectively. The p0 in the test statistic is the probability that an interaction with r2 > goodness-of-fit threshold and slope ratio < slope ratio threshold is observed by chance (the formula is given in Methods) and given as p0 = 2,180/6282 = 0.0055. The pink and blue shading indicates statistically significance as p < 0.005 (one-sided probability). The values (i-th row, j-th column) are for the interactions for which directionality13 was assigned such that the TFs in a class in the i-th row → the TFs in a class in the j-th column. (c) System-wide ladder-like structure of statistically significant inter-class interactions. External inputs were suggested to be supplied to classes B1 and B2.

