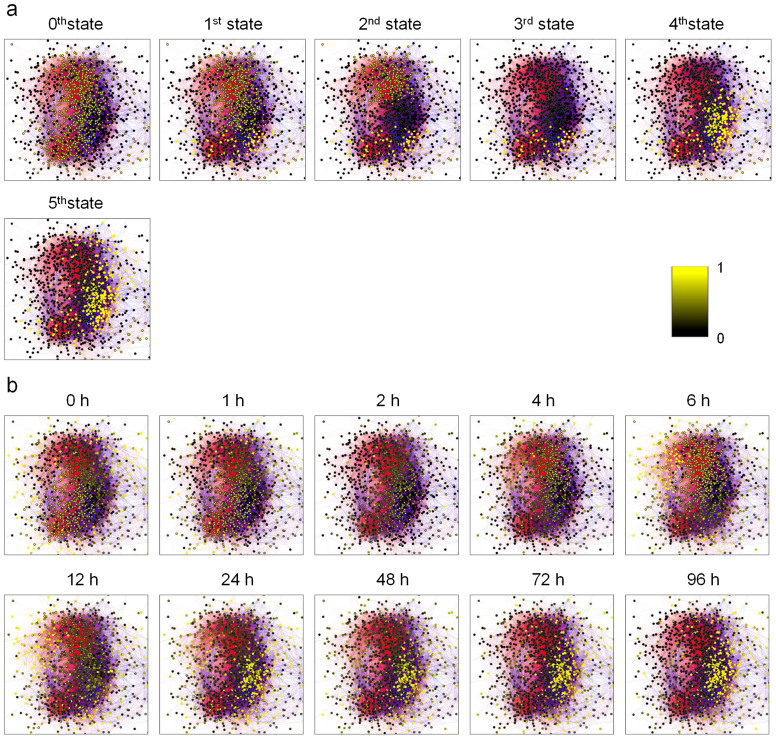
Figure 5. TF-level views of the simulated and actual expression pattern transitions in the transcriptional network.
(a) Simulated expression patterns of the 0th to 5th states after supplying the step functions, 0 → 1 to class B1 and 1 → 0 to class B2, which modelled the external input by PMA. In these images the averaged expression levels between the two trajectories (from α9 to α6 and from α10 to α7 (Fig. 4)) are displayed. (b) Actual expression patterns 0 to 96 hours after starting PMA treatment. The coloured bar on the right hand side indicates the expression level of the TFs in both panels.

