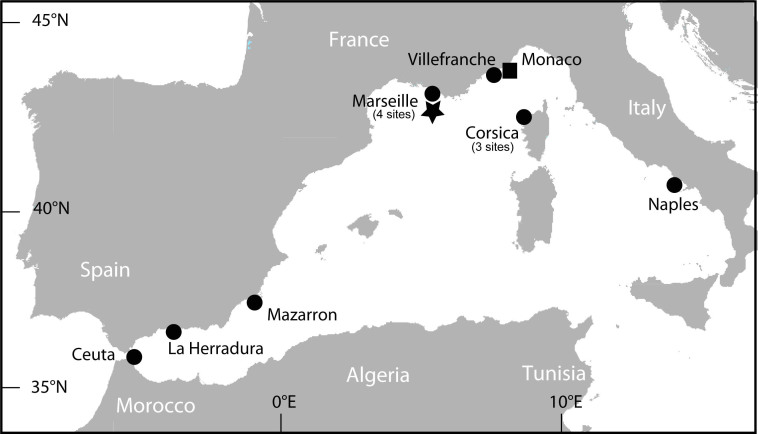
Figure 3. Map of the Western Mediterranean with Parazoanthus axinellae sampling locations indicated as black circles (see details in Table 1).
Black square represents the site (Mo1) where a 1-yr time series was conducted. Black star represents the sampling location for the outgroup Savalia savaglia (Marseille). This map was obtained from http://d-maps.com/carte.php?num_car=3122&lang=fr (Date of access: 16 Apr. 2013) and modified under Adobe Illustrator.

