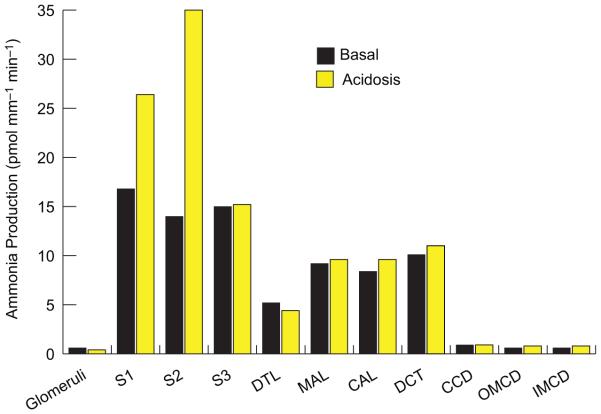
Figure 5.
Ammonia production in various renal segments. Ammonia production rates in different renal components measured in microdissected tubule segments from rats on control diets and after inducing metabolic acidosis. All segments produced ammonia. Metabolic acidosis increases total renal ammoniagenesis, but only through increased production in proximal tubule segments (S1, S2, and S3). Rates calculated from measured ammonia production rates and mean length per segment as described in (49). Size of pie graph is proportional to total renal ammoniagenesis rates. Abbreviations: DTL, descending thin limb of Henle’s loop; MAL, medullary thick ascending limb of Henle’s loop; CAL, cortical thick ascending limb of Henle’s lop; DCT, distal convoluted tubule; CCD, cortical collecting duct; OMCD, outer medullary collecting duct; IMCD, inner medullary collecting duct.

