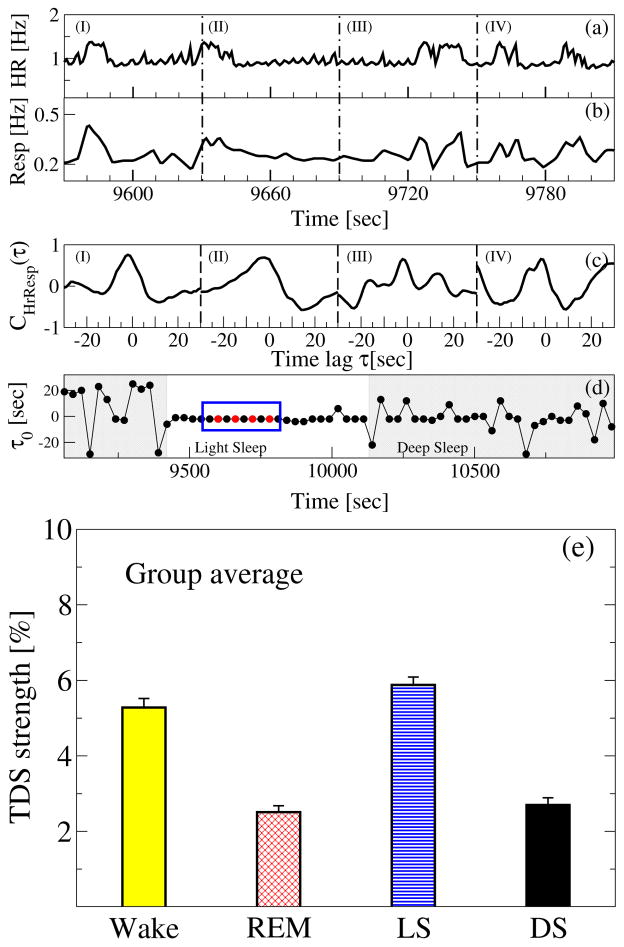
Figure 7. Third form of cardio-respiratory coupling: time delay stability (TDS).
Segments of (a) heart rate (HR) and (b) respiratory rate (Resp) in 60 sec time windows (I), (II), (III) and (IV). Synchronous bursts in HR and Resp (signals normalized to zero mean and unit standard deviation) lead to pronounced cross-correlation (c) within each time window in (a) and (b), and stable time delay characterized by segments of constant τ0 as shown in (d) — four red dots highlighted by a blue box in panel (d) represents the time delay for the 4 time windows. Note the transition from strongly fluctuating behavior in τ0 to a stable time delay regime at the transition from deep sleep to light sleep at around 9400 sec (shaded area) in panel (d). The TDS analysis is performed on overlapping moving windows with a step of 30 sec. Long periods of constant τ0 indicate strong TDS coupling. (e) Note the pronounced stratification pattern in TDS: stronger coupling during wake and light sleep, and weaker during REM and deep sleep, which is very different from the stratification pattern of RSA and CRPS across sleep stages in Fig. 5.

