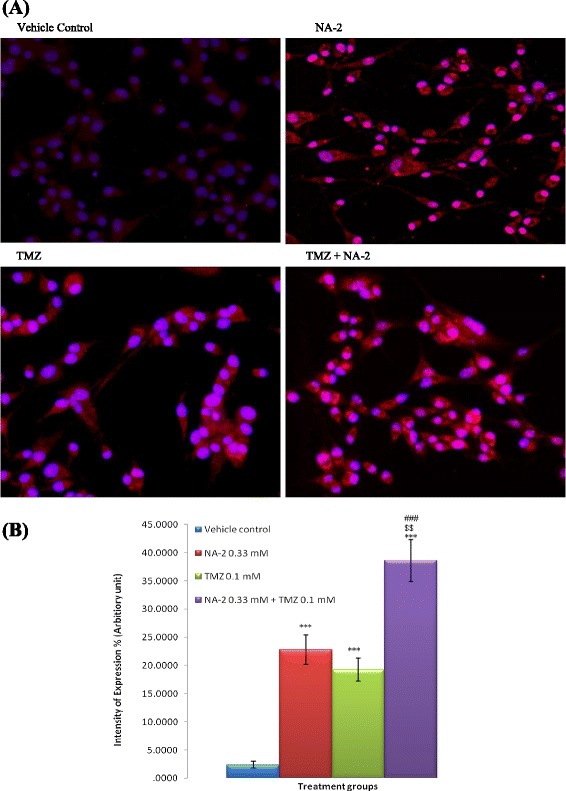
Figure 5.

Effect of NA-2 and TMZ alone and in combination on active caspase-3 expression. (A) Representative Photomicrographs of cleaved caspase-3 immunoreactivity in control (DMSO treated) and treated group of U87 cells. Base line immunofluorescence was detected in control group. Significant Increase in immunofluorescence is detected in all treated groups with the highest observed intensity in combination treatment group (NA-2 + TMZ). (B) Quantification of cleaved caspase-3 expression using Image J software, cells were counted in the field then percent intensity (arbitrary unit) was calculated. Each bar represents mean ± S.E.M of three independent experiments. Significant difference between vehicle control and treated cells was indicated ***P <0.001. The significant difference between the individual drugs NA-2 or TMZ and their combination treatment is indicated by $$ P <0.01, and ### P <0.001 respectively.
