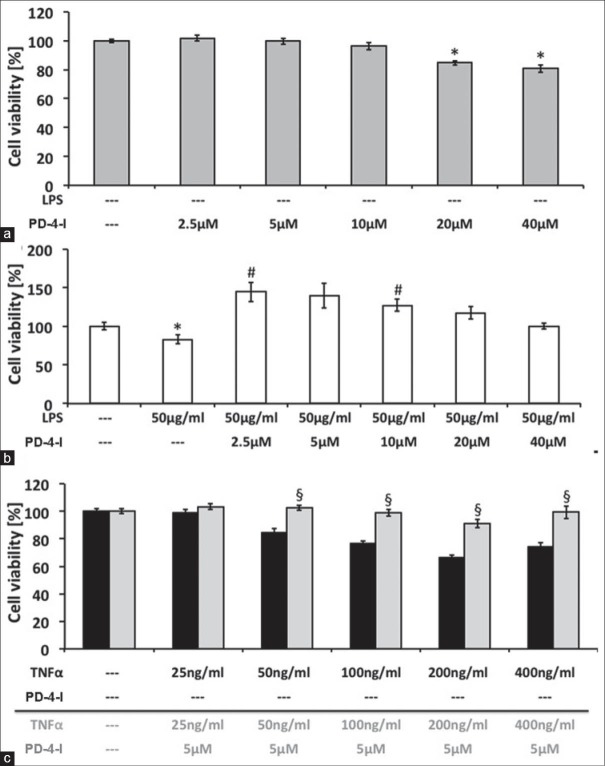
Figure 6.
HepG2 cell culture: Cell viability of PD-4-I-incubated cells (A) and in presence of 50 μg/ml LPS, showing a compromised viability with 50 ng/ml LPS and a cytoprotective effect of 2.5 μM and 10 μM PD-4-I. (C) Cell viability of different concentrations of TNF-α with and without 5μM PD-4-I, revealing cytoprotective effects of PD-4-I incubation at 50-400 ng/ml. (*vs. 0%, #vs. 50 μg/ml LPS; §vs. corresponding TNF-α-only incubated cells, n = 32-64, P≤ 0.05, mean ± SEM)

