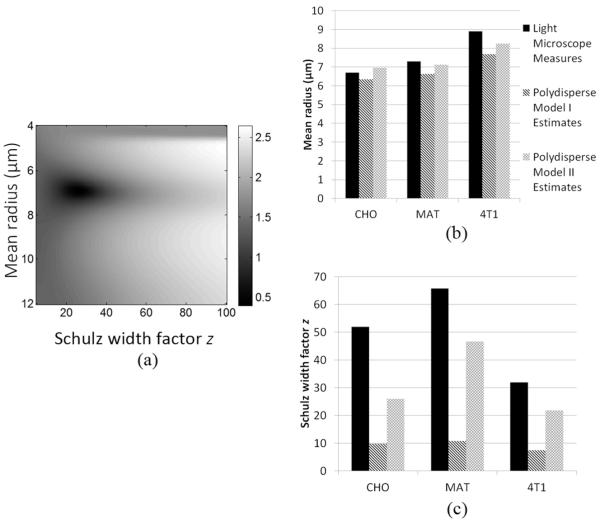
Fig. 8.
(a) A representative 2-D cost function map: the logarithm of the cost function C(a, z) for polydisperse model II obtained from experimental structure function for CHO. (b) a comparison between the mean radii estimated by polydisperse model I and II and direct light microscope measures. (c) A comparison between the estimated and directly measured parameter z. The legends in (c) are the same as in (b).

