Figure 4.
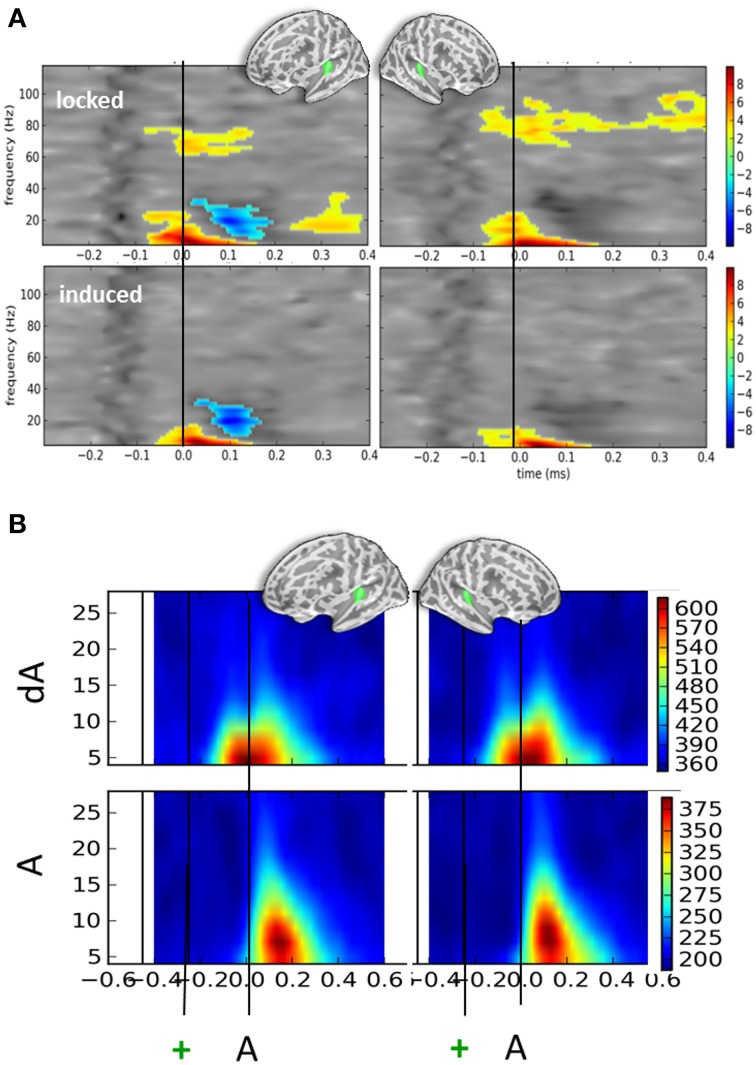
Time-frequency contrasts of all DEV vs. STD trials irrespective of auditory location or eye position. (A) T-maps of significant time-frequency clusters contrasting all DEV trials (dA) minus all STD trials (A) in left and right auditory cortices (left and right panels, respectively). The top panels illustrate the contrasts using typical time-frequency analysis on single trials thereby including a mix of phase-locked and induced activities (“locked”). The bottom panels illustrate the same dA-A contrast: in this analysis, the average evoked response was removed from the single trials prior to classic time-frequency analysis (see Methods). This amounts to drastically removing phase-locked activity (“induced”). In both cases, significant temporal clusters starting prior to sound onset (black line) were seen. In DEV trials, a significant increase of alpha and beta power was observed as compared to STD trials. An additional significant decrease of beta power was observed in the left auditory cortices. In the “locked” panels, a significant increase of high gamma power (~80 Hz) was seen bilaterally suggesting that sounds preceded by a transient color change (DEV, dA trials) evoked more high-gamma power than those that were not (STD, A trials). The bilateral increase of alpha power observed in auditory cortices is consistent with attention oriented toward counting visual events in this task. (B) Phase-locking values (PLV) observed in DEV (dA, top) and STD (A, bottom) trials. Note that alpha PLV are much higher and occur earlier in dA as compared to A. Actual scaling for PLV should be divived by 1000 (i.e., 600 on the scale corresponds to a PLV of 0.6).

