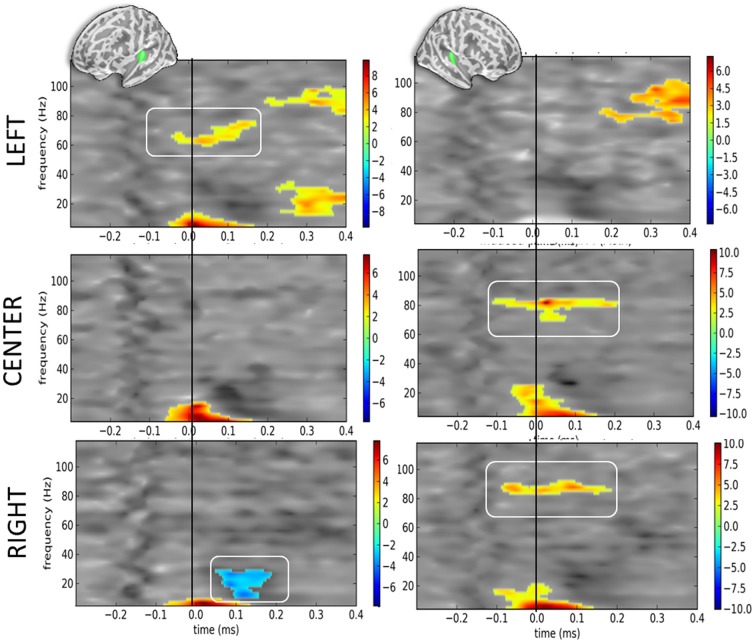
Figure 5.
Time-frequency t-maps of DEV vs. STD contrasts as a function of sound location. Each graph reports the t-maps of the DEV minus STD time-frequency contrasts separately for the left and right hemispheres (left and right panels, respectively) and as a function of sound location. Top panels: ≪ LEFT ≫ are sounds presented to the left ear: t-maps report the contrast dAL minus AL irrespective of eye positions. During DEV trials, sounds presented to the left ear (dAL) elicited a significant increase of high-gamma power as compared to the same sounds during STD trials (AL). This was only observed in the contralateral auditory cortices, here the left hemisphere. Middle panels: ≪ CENTER ≫ are sounds presented to both ears: t-maps report the contrast dAC minus AC irrespective of eye positions. A significant increase of high-gamma power was observed in the right auditory cortices in DEV trials (dAC) as compared to STD trials (AC). Bottom panels: ≪ RIGHT ≫ are sounds presented to the right ear: t-maps report the contrast dAR minus AR. DEV sounds presented to the right ear (dAR) elicited a significant increase of high-gamma band power in the right auditory cortices as compared to STD trials. Additionally, a significant beta power decrease was observed in the left auditory cortices.

