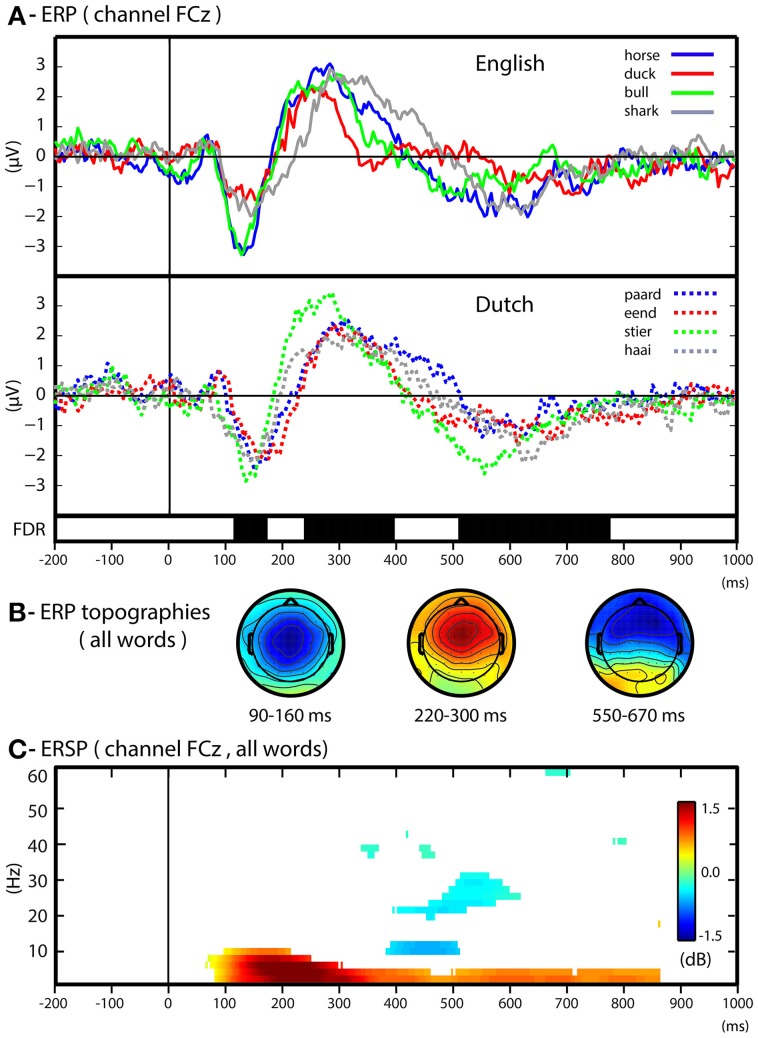
Figure 3.
Univariate results. (A) ERP in respect to baseline of each word over the channel FCz. The ERPs for English and Dutch words are plotted separately. Group level statistics of all words with respect to baseline (Wilcoxon's test, FDR corrected < 0.05) is depicted in black bars during the time course of the ERP responses. (B) ERP scalp maps for time-intervals characteristic of the ERP components (N1: 90–160; P2: 220–300; N400: 550–670). (C) ERSP (dB) with respect to baseline for all words. The ERSP time-frequency plot includes a statistical threshold for group level significance (Wilcoxon's test in respect to baseline period, FDR correction, alpha = 0.05).

