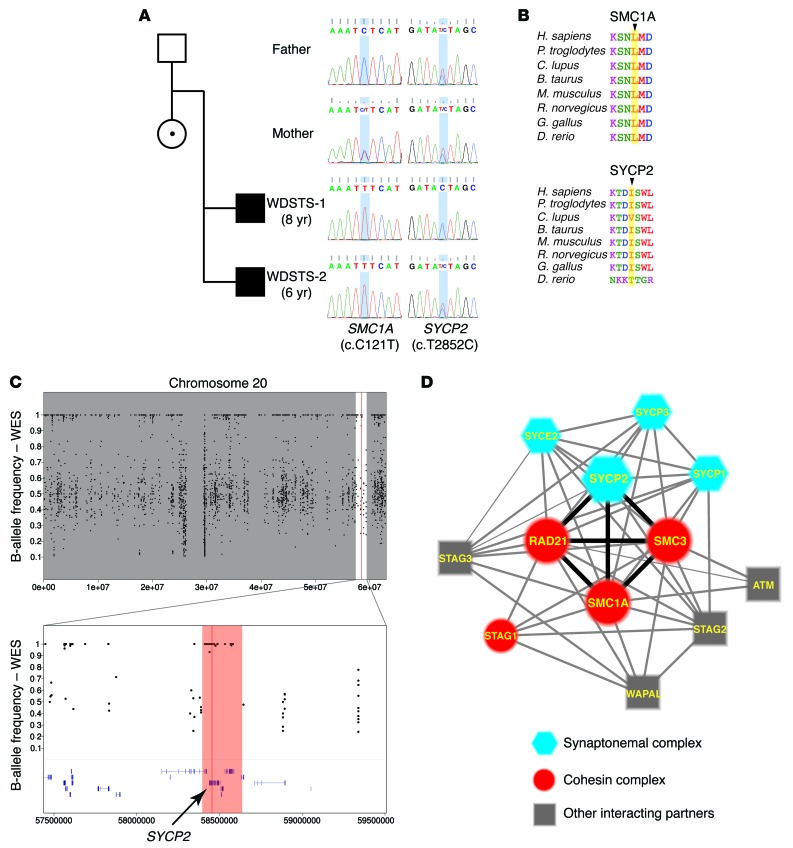
Figure 2. The variants in SMC1A and SYCP2 identified in the patients with WDSTS (WDSTS-1 and WDSTS-2).
(A) Pedigree of the family and the Sanger-sequencing chromatogram showing the segregation analysis of variants identified in SMC1A and SYCP2. The blue shading in the chromatograms marks the position of the variants. The genes and nt changes are shown underneath the chromatograms. (B) Peptide alignments showing the conservation of the affected aa across different species. First panel: Leu41 in SMC1A. Second panel: Ile951 in SYCP2. All these aa are highlighted by yellow shading, and they are highly conserved across the species. (C) The B-allele frequency plots from the WES data of WDSTS-1. The upper panel shows the overall B-allele frequencies of the entire chromosome 20. The lower panel shows the zoomed-in view of the region surrounding the variant (Chr20: g.58455447 A>G [hg19]). The region highlighted by red shading represents the AOH region, including the gene SYCP2, which is indicated by the black arrow. (D) The interaction network that includes both SC and the cohesin complex. Blue hexagons, major components of the SC; red circles, major components of the cohesin complex; gray squares, other interacting partners involved in this network. Heavy black lines show the strong interactions between the SYCP2 and the 3 major components of the cohesin complex: SMC1A, SMC3, and RAD21.

