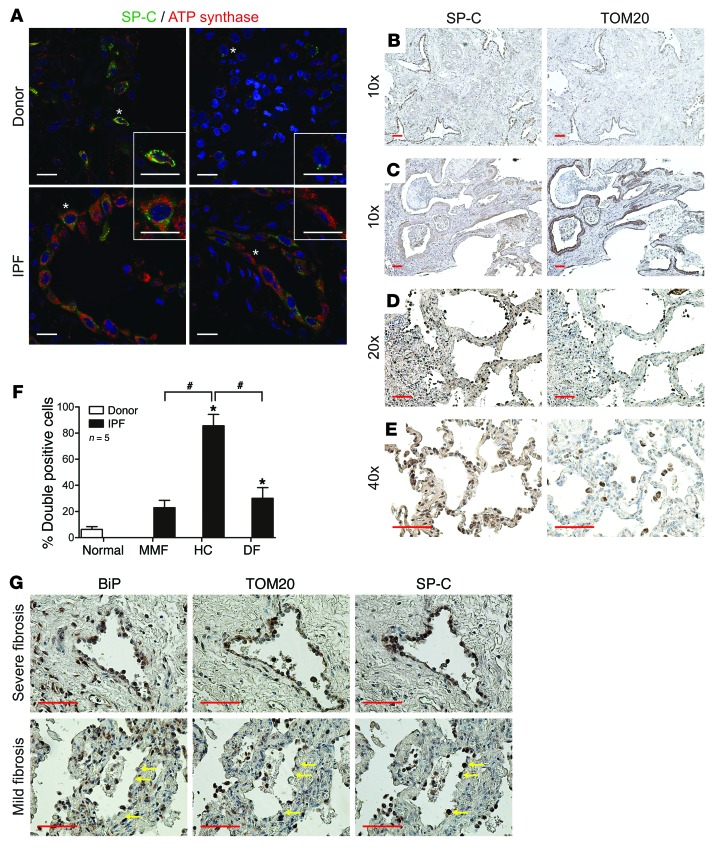
Figure 1. Mitochondrial accumulation in AECIIs from dense fibrotic areas in IPF lungs.
(A) Representative immunofluorescence using anti–SP-C (AECII marker; green) and anti–ATP synthase (mitochondrial marker; red) antibodies, showing mitochondrial accumulation in hyperplasic AECIIs from honeycombs in IPF lung (n = 7 per group). Representative cells (asterisks) are shown in detail in the insets. Scale bars: 10 μm. (B–E) Representative immunohistochemistry images (n = 6) in consecutive sections from IPF (B–D) and donor control (E) lungs using anti–SP-C and anti-TOM20 (mitochondrial marker) antibodies. Epithelial cells from honeycomb areas (B and C) showed positive staining for both markers. Epithelial cells from areas with mild fibrosis (D) and donor control lung (E) showed less positive signal for the mitochondrial marker. Note the high positivity for TOM20 in macrophages located in alveolar spaces in donor control lung. Scale bars: 50 μm. (F) Semiquantitative scoring of SP-C/ATP synthase double-positive cells as a percentage of total SP-C–stained cells from 5 cases. MMF, mild moderated fibrosis; HC, honeycomb; DF, dense fibrosis. Data represent mean ± SEM. *P < 0.01 vs. normal, #P < 0.01 as indicated, 1-way ANOVA with post-hoc Bonferroni. (G) Representative images (n = 3) of immunohistochemistry analyses in consecutive sections from IPF lungs using BiP (ER stress marker), anti–SP-C, and anti-TOM20 antibodies. Arrows denote SP-C–positive cells on mild fibrosis cases. Scale bars: 50 μm.

