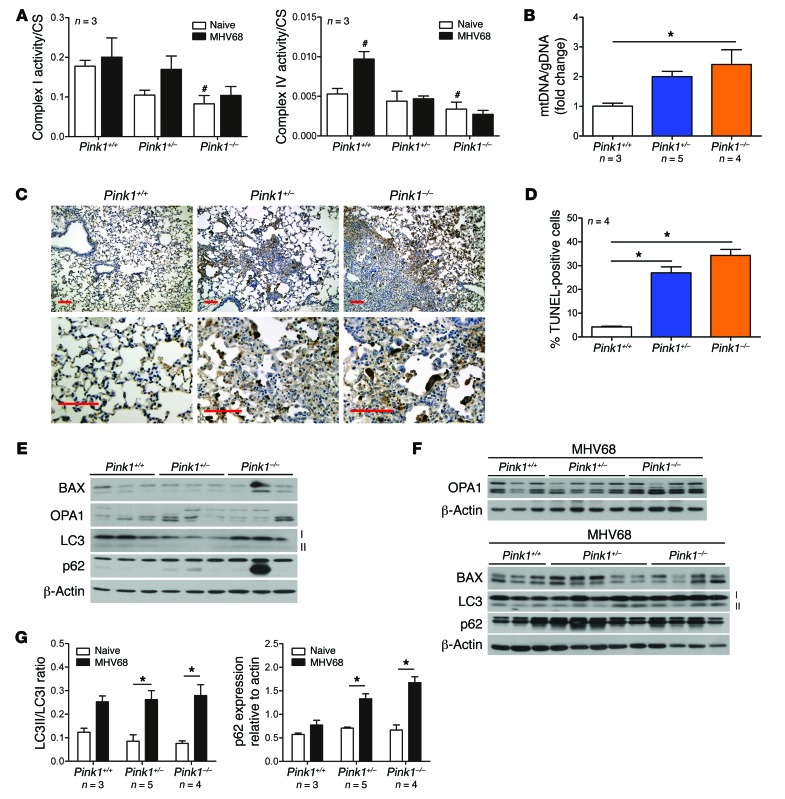
Figure 10. Mitochondrial dysfunction and increased cell apoptosis in PINK1-deficient mice.
(A) Complex I and complex IV activity, both basal and after MHV68 infection, was reduced in Pink1–/– versus Pink1+/+ lung mitochondria. CS, citrate synthase. (B) Mitochondrial mass (assessed by mtDNA/gDNA ratio) in lungs of infected Pink1+/+, Pink1+/–, and Pink1–/– mice. (C) Representative in situ TUNEL assay in lung sections at day 15 after MHV68 infection. Note the increase in positive signal (brown) in PINK1-deficient lungs. Scale bars: 50 μm. (D) Semiquantitative analyses showed significantly higher TUNEL-positive signal in PINK1-deficient versus control mice. (E and F) Immunoblot analyses in whole lung lysates from naive (E) and MHV68-infected (F) Pink1+/+, Pink1+/–, and Pink1–/– mice for BAX, OPA1, and the autophagic markers LC3I/LC3II and p62. Blots were stripped and reblotted with β-actin for loading normalization. Each lane represents an individual mouse. (G) Density analyses of LC3 and p62. Data represent mean ± SEM (A, B, D, and G). #P < 0.05 vs. Pink1+/+; *P < 0.05; 1- (B and D) or 2-way (A and G) ANOVA with post-hoc Bonferroni.

