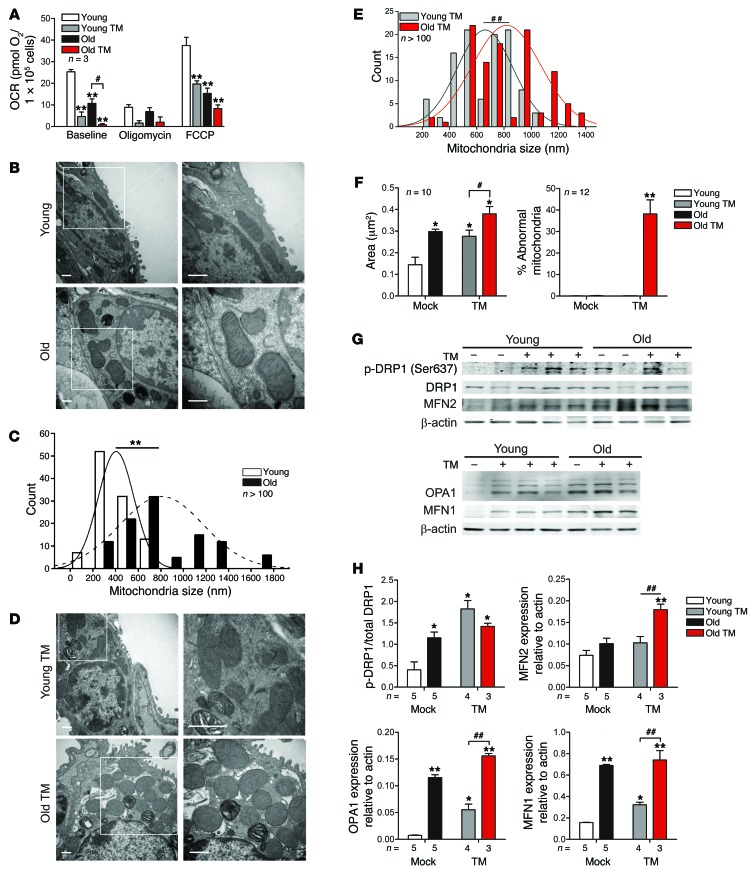
Figure 4. Impaired mitochondrial function and fission/fusion dynamics in AECIIs with age.
(A) Mitochondrial respiration parameters in isolated primary AECIIs from young and old C57BL/6 mice with vehicle control or TM treatment (1 μg/ml for 1 hour). (B) Representative TEM (n = 3 per group) showing enlarged mitochondria but preserved structure in AECIIs from naive old mice. Boxed regions are shown enlarged at right. Scale bars: 500 nm. (C) Quantitative morphometry showed significantly increased frequency of large mitochondria in AECIIs from naive old mice (n ≥ 100 per condition). (D) Representative TEM (n = 3 per group) showing enlarged mitochondria in AECIIs from TM-treated young and old mice. Boxed regions are shown enlarged at right. Scale bars: 500 nm. (E) Morphometry showed increased frequency of large mitochondria in young and old AECIIs after TM treatment (n ≥ 100 per condition). (F) Area of AECII mitochondria and percentage of abnormal mitochondria (swollen with evidence of severely disrupted cristae over all mitochondria) from TEM images. (G) Representative Western blot membranes showing higher expression levels of mitochondrial fusion modulators (p-DRP1, MTF2, OPA1, and MTF1) in lungs from young and old mice treated with TM. (H) Density analyses of Western blots for fusion and fission mitochondrial modulators. Data represent mean ± SEM (A, F, and H). *P < 0.05, **P < 0.01 vs. young; #P < 0.05, ##P < 0.01 as indicated, 2-tailed Student’s t test (A, C, and E) or 1-way ANOVA with post-hoc Bonferroni (F and H).

