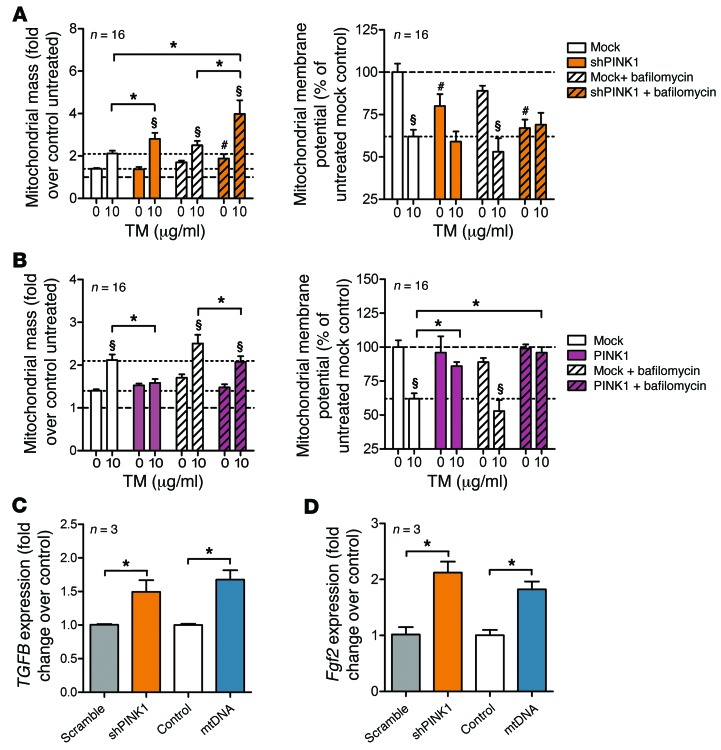
Figure 8. PINK1 modulates mitochondrial homeostasis.
(A) Mitochondrial mass and depolarization in A549 cells transfected with scramble control (Mock) or PINK1 shRNA (shPINK1), assessed by MitoTracker Green FM and JC-1 staining, respectively. Downmodulation of PINK1 was detrimental upon TM treatment 48 hours after transfection, inducing a higher accumulation of depolarized mitochondria. Bafilomycin A1 (10 nM) further increased mitochondrial numbers and depolarization. Data represent mean ± SEM of 16 replicates per condition. (B) Mitochondrial mass and depolarization induced by TM and/or bafilomycin A1 treatment was improved by PINK1 overexpression. Data represent mean ± SEM of 16 replicates per condition. (C and D) Increased levels of TGFB (C) and FGF2 (D) mRNA in A549 cells after PINK1 downregulation by shRNA or after treatment with mtDNA. (A–D) Data represent mean ± SEM. §P < 0.05 vs. respective no-TM control, #P < 0.05 vs. no-TM Mock; *P < 0.05 as indicated, 1-way ANOVA with post-hoc Bonferroni.

