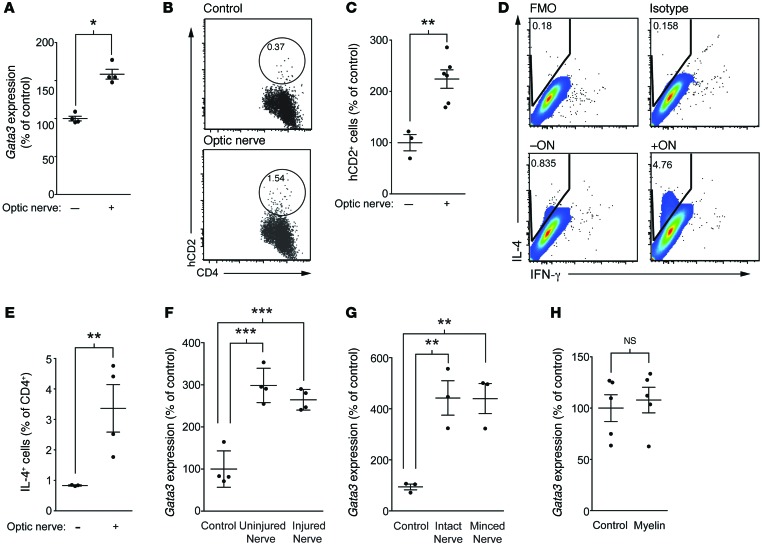
Figure 5. CNS tissue skews T cells toward a Th2 phenotype.
(A) CD4+ T cells from total lymph nodes were incubated with optic nerves and antigen-presenting cells. After culture, CD4+ T cells were resorted and Gata3 expression analyzed using qRT-PCR (relative to Gapdh) (n = 3 per group; representative of >3 experiments). (B) Representative flow cytometry plots and (C) quantification of human CD2 (hCD2) expression (reporter for IL-4 protein; KN2 mice) in cultures of lymph node cells incubated with or without optic nerves (n = 3, control; n = 7, optic nerve; representative of 2 experiments). (D) Representative flow cytometry plots and (E) quantification of IL-4+CD4+ T cells in cultures of lymph node cells incubated with or without optic nerves, as a percentage of CD4+ T cells (n = 4, control; n = 4, optic nerve; representative of 3 experiments). (F) Gata3 expression in sorted CD4+ T cells after culture in the presence of optic nerves isolated from either injured or naive mice (n = 4 per group; representative of 2 experiments). (G) Gata3 expression in the presence of optic nerves that had been minced or left intact (n = 3 per group; representative of 2 experiments). (H) CD4+ T cells from deep cervical lymph nodes and antigen-presenting cells were incubated in the presence or absence of 80 μg of myelin vesicles before CD4+ T cells were resorted and assayed for Gata3 relative to Gapdh (n = 5 per condition; representative of 2 experiments). (A, C, E, and H) *P < 0.05, **P < 0.01, 2-tailed Student’s t test. (F and G) **P < 0.01, ***P < 0.001, 1-way ANOVA with Bonferroni’s post-test. Error bars represent SEM.

