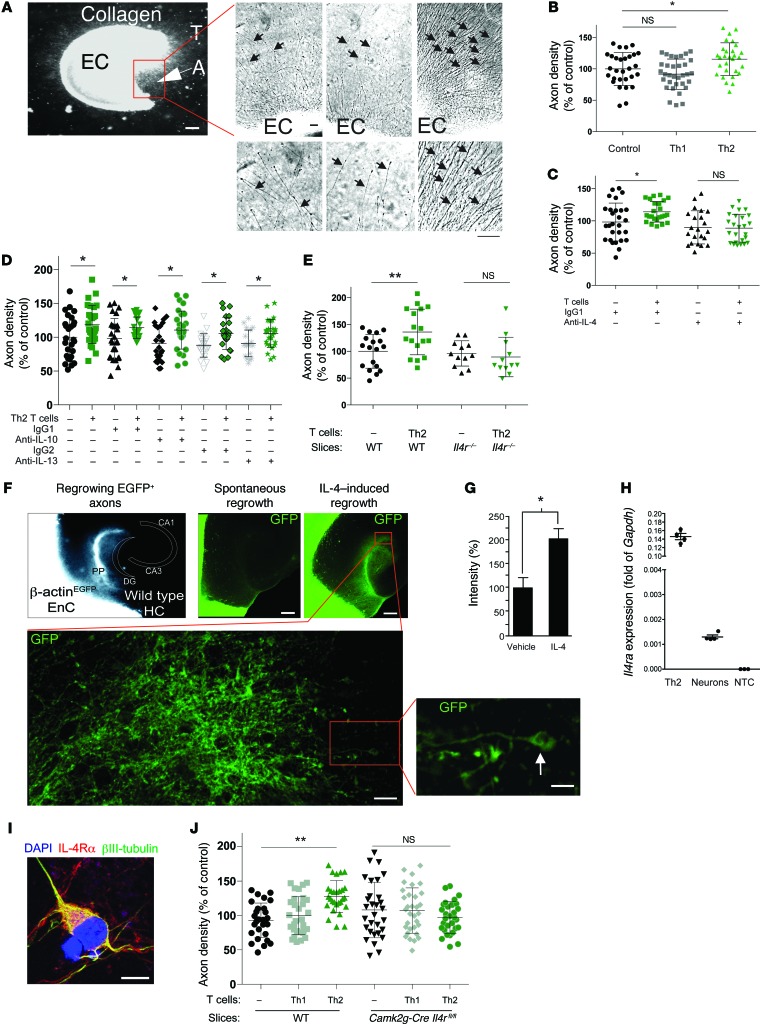
Figure 8. T cell–derived IL-4 acts on neurons to induce axonal regrowth.
(A) Cortical ECs with outgrowing axons (A) oriented toward the T cells (T). Scale bar: 300 μm. (B) Culture of Th2 cells with cortical ECs (n = 29–33 per condition). (C) Coculture of wild-type slices with activated Th2 cells in the presence of neutralizing anti–IL-4 antibody (n = 22–25 per condition). (D) Coculture of wild-type slices with activated Th2 cells in the presence of neutralizing anti–IL-10 or anti–IL-13 antibodies (n > 12 per group). (E) Axon growth of slices derived from Il4r–/– mice in the presence or absence of Th2 cells (n = 12–18 per condition). (F) Axon ingrowth coculture model of the entorhinal cortex and hippocampus in vitro (33). Entorhinal cortex (EnC) explants of mice, which express EGFP under control of the β-actin promoter with wild-type hippocampus (HC). The perforant path (PP) fibers originating from EGFP+ EC slices reinnervated the dentate gyrus (DG). CA, cornu ammonis. Scale bars: 300 μm (top); 15 μm (bottom left); 3 μm (bottom right). (G) Quantification of the EGFP+ area in the hippocampus in the presence of recombinant IL-4 (500 ng/ml) (n = 14–15 per condition). (H) qRT-PCR of primary neurons and Th2 cells. NTC, no template control. (I) IL-4Rα immunofluorescent staining of cultured neurons. Scale bar: 10 μm. (J) Axon density from slices obtained from Camk2g-Cre Il4rfl/fl mice incubated with Th2 cells (n = 28–32 per condition). (B–E, H, and J) *P < 0.05, **P < 0.01, 1-way ANOVA with Bonferroni’s post-test. (G) *P < 0.05, 2-tailed Student’s t test. Error bars represent SEM.

