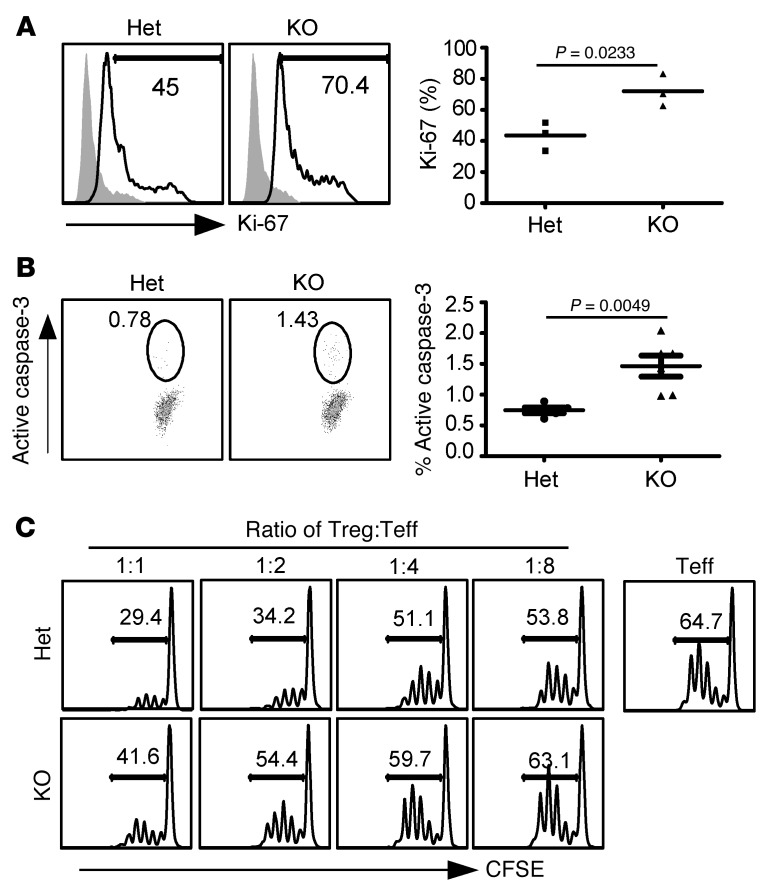
Figure 4. Increased turnover of Tregs and their compromised in vitro suppressive function in the absence of GP96.
(A) IC Ki-67 stain of CD4+FOXP3GFP+ Tregs and quantification of the ratio of Ki-67–positive cells in total Tregs. Data are representative of 2 independent experiments. Two-tailed Student’s t test was used for comparisons of different experimental groups. (B) Treg apoptosis was assayed by active caspase-3 staining. Numbers represent percentages of active caspase-3+ cells among total Tregs. Data are representative of 2 independent experiments. Two-tailed Student’s t test was used for comparisons between Het and KO mice. (C) Suppression of proliferation of CFSE-labeled CD4+CD25– T cells by splenic CD4+CD25+ T cells from KO mice and control littermates. Percentages of CFSElo in the population of all CD4+ cells are indicated. Five individual experiments were performed with similar findings.

