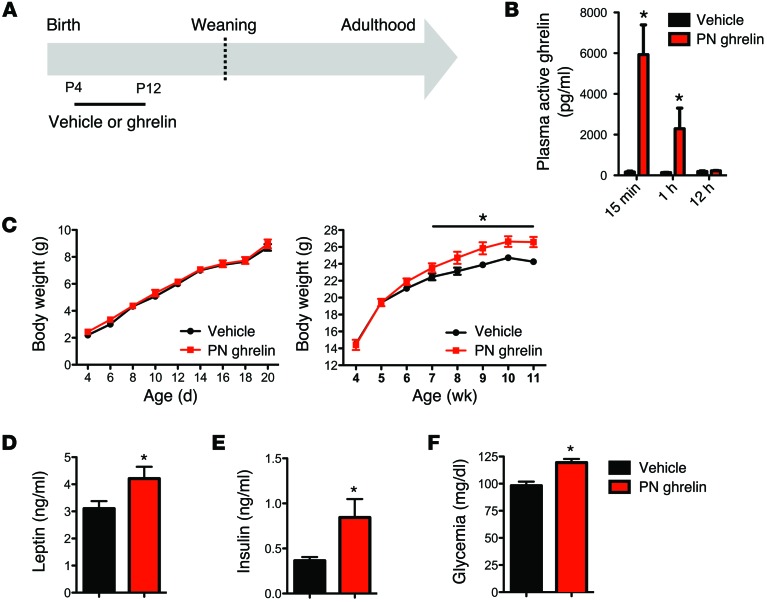
Figure 6. Chronic neonatal hyperghrelinemia causes metabolic disturbances.
(A) Schematic representation of the experimental design used to increase ghrelin levels during neonatal life. Starting at P4, pups were treated daily with i.p. injections of ghrelin (2 mg/kg) (PN ghrelin) or vehicle (control), for a total of 8 days. (B) Acylated ghrelin levels in P10 mice injected with vehicle (0.9% NaCl) or ghrelin (2 mg/kg) (n = 4 for vehicle; n = 6 for PN ghrelin). Values are shown as the mean ± SEM. *P < 0.05 vs. control. (C) Pre- and postweaning growth curves (body weights) of mice neonatally injected with control or ghrelin (n = 5 for vehicle; n = 7 for PN ghrelin). (D) Plasma leptin and (E) insulin levels at 90 days of age in mice neonatally injected with control or ghrelin (n = 4 for control; n = 5 for PN ghrelin). (F) Fasting glucose levels in P80 mice neonatally injected with control or ghrelin (n = 5 for control; n = 7 for PN ghrelin). Values are shown as the mean ± SEM. *P < 0.05 vs. vehicle. Statistical significance was determined using 2-tailed Student’s t tests (D–F) and a 2-way ANOVA followed by Bonferroni’s post-hoc test (B and C).

