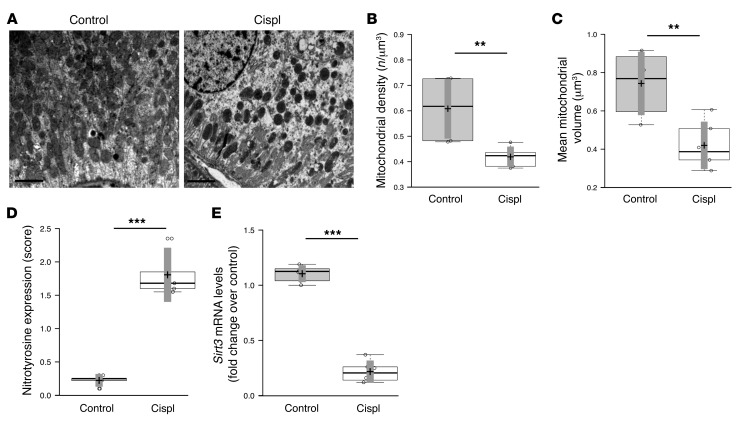
Figure 1. Mitochondrial dysregulation and SIRT3 expression in mice with cisplatin-induced AKI.
(A) Representative transmission electron micrographs of the ultrastructure of mouse proximal tubular cells obtained from resin-embedded kidney sections of control and cisplatin-treated (Cispl) mice at 4 days. Scale bars: 2 μm. (B and C) Quantification of mitochondria per volume (n/μm3) and mean mitochondrial volume (μm3) by morphometric analysis in proximal tubular cells of control and cisplatin-treated mice. **P < 0.01, unpaired Student’s t test. n = 6 mice per group. (D) Staining score of nitrotyrosine, a marker of peroxynitrite, assessed in kidney cortex of control and cisplatin-treated mice. ***P < 0.001, unpaired Student’s t test. n = 5 mice per group. (E) Whole kidney expression of Sirt3 mRNA analyzed by real-time PCR in control and cisplatin-treated mice. ***P < 0.001, unpaired Student’s t test. n = 6 mice per group.

