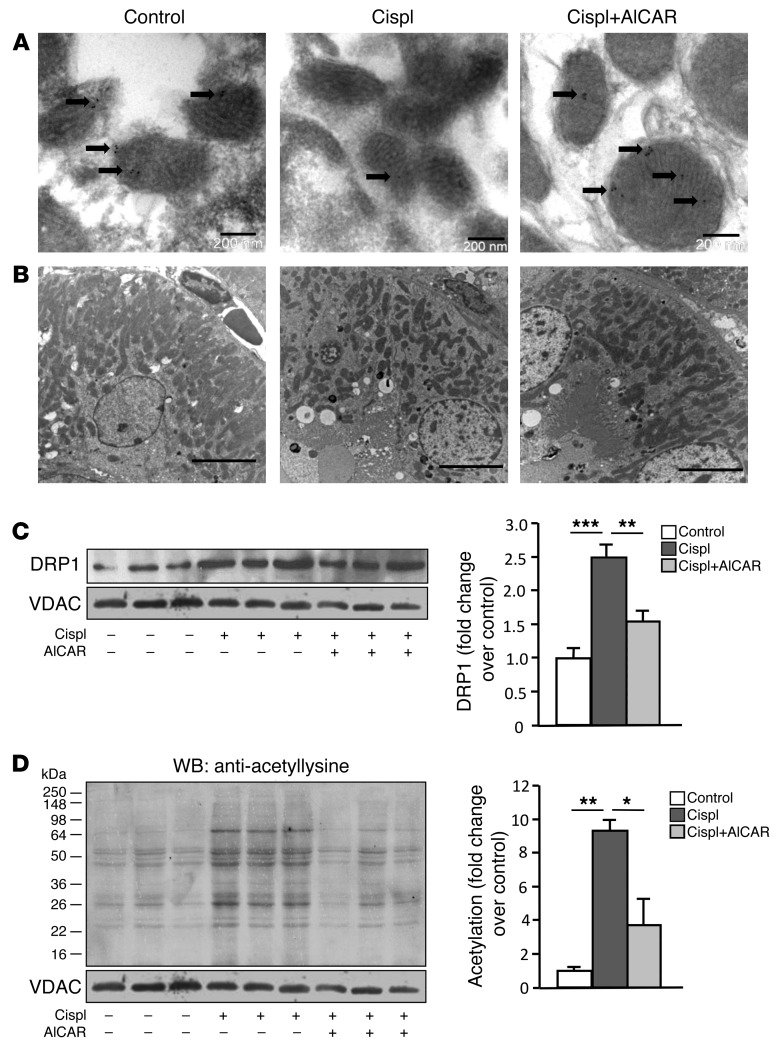
Figure 3. AICAR limits mitochondrial fragmentation and restores SIRT3 protein and activity.
(A) Pattern of immunogold labeling for SIRT3 (arrows) in tubular cell mitochondria of control and cisplatin-treated mice given saline or AICAR at 4 days. Scale bars: 200 nm. (B) Representative transmission electron micrographs of the proximal tubular cell ultrastructure obtained from kidney sections of control and cisplatin-treated mice given saline or AICAR at 4 days. Scale bars: 5,000 nm. (C) Western blot and densitometric analysis of DRP1 protein expression in purified mitochondrial fraction isolated from renal tissue of control and cisplatin-treated mice given saline or AICAR at 4 days. VDAC protein expression was used as a sample loading control on the same membrane after stripping. **P < 0.01 and ***P < 0.001, ANOVA corrected with Bonferroni coefficient. Values are mean ± SEM (n = 3 mice per group). (D) Western blot (WB) and densitometric analysis of protein acetylation in mitochondria isolated from renal tissue of control and cisplatin-treated mice given saline or AICAR at 4 days. VDAC protein expression was used as a sample loading control on the same membrane after stripping. *P < 0.05 and **P < 0.01, ANOVA corrected with Bonferroni coefficient. Values are mean ± SEM (n = 3 mice per group). VDAC blots reported in C and D derived from the same gel.

