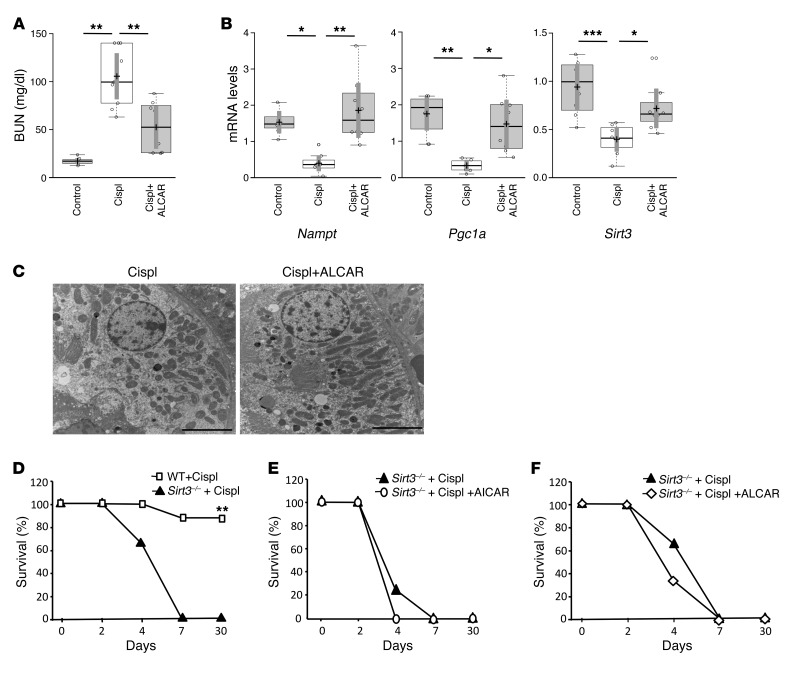
Figure 4. The antioxidant ALCAR protects mice from AKI by enhancing SIRT3.
(A) Renal function in control and cisplatin-treated mice given saline or ALCAR at 4 days. **P < 0.01, ANOVA corrected with Bonferroni coefficient. n = 8 control mice; n = 8 cisplatin mice+saline; n = 9 cisplatin mice+ALCAR. (B) Whole kidney expression of Nampt, Pgc1a, and Sirt3 mRNA analyzed by real-time PCR in control and cisplatin-treated mice given saline or ALCAR at 4 days. *P < 0.05, **P < 0.01, and ***P < 0.001, ANOVA corrected with Bonferroni coefficient. n = 7–8 mice for each group. (C) Representative transmission electron micrographs of the proximal tubular cell ultrastructure from kidney sections of cisplatin-treated mice given saline or ALCAR at 4 days. Scale bars: 5,000 nm. (D) Survival curves of WT and Sirt3–/– mice with cisplatin-induced AKI. **P < 0.01, log-rank test. n = 8 WT cisplatin-treated mice; n = 7 Sirt3–/– cisplatin-treated mice. (E) Effect of AICAR treatment on survival of Sirt3–/– cisplatin-treated mice. n = 7 Sirt3–/– cisplatin mice+saline; n = 6 Sirt3–/– cisplatin mice+AICAR. (F) Effect of ALCAR treatment on survival of Sirt3–/– cisplatin-treated mice. n = 8 Sirt3–/– cisplatin mice+saline; n = 6 Sirt3–/– cisplatin mice+ALCAR. Values are mean ± SEM.

