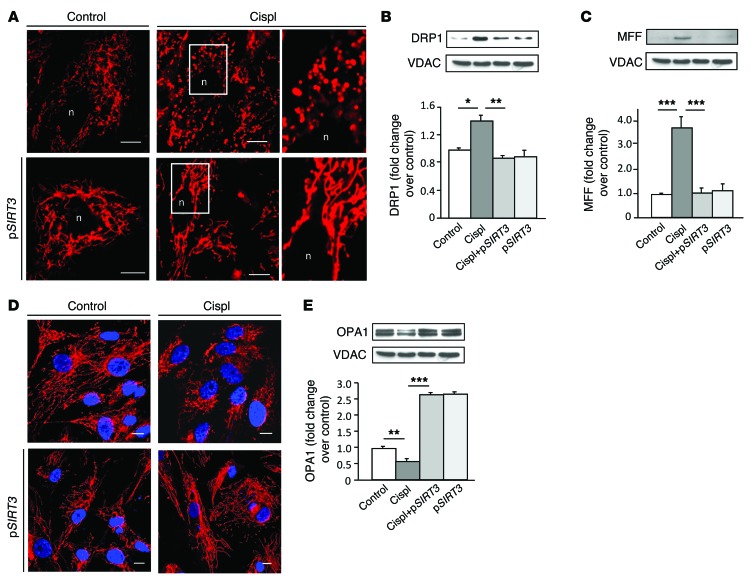
Figure 6. SIRT3 counteracts cisplatin-induced mitochondrial dynamic perturbation in injured tubular cells in culture.
(A) Representative images showing a mitochondrial network of RPTECs untransfected (top) or transfected with SIRT3 plasmid (pSIRT3, bottom) and exposed to medium or cisplatin (5 μM for 24 hours). Insets display fragmented (top) and elongated mitochondria (bottom) visualized by staining with MitoTracker Deep Red. Scale bars: 10 μm. (B and C) Representative Western blots and densitometric analysis of DRP1 and MFF protein expression in mitochondria isolated from control and cisplatin-treated RPTECs overexpressing or not pSIRT3. VDAC protein expression was used as a sample loading control on the same membrane after stripping. *P < 0.05, **P < 0.01, and ***P < 0.001, ANOVA corrected with Bonferroni coefficient. Values are mean ± SEM (n = 3 experiments). (D) Representative images of OPA1 immunofluorescence staining in control and cisplatin-injured RPTECs untransfected (top) or transfected with pSIRT3 (bottom). Nuclei were counterstained with DAPI (blue). Scale bars: 10 μm. (E) Representative Western blot and densitometric analysis of OPA1 protein expression in mitochondria isolated from control or cisplatin-treated RPTECs overexpressing or not pSIRT3. **P < 0.01, and ***P < 0.001, ANOVA corrected with Bonferroni coefficient. Values are mean ± SEM (n = 3 experiments). VDAC blots reported in B, C, and E derive from the same gel.

