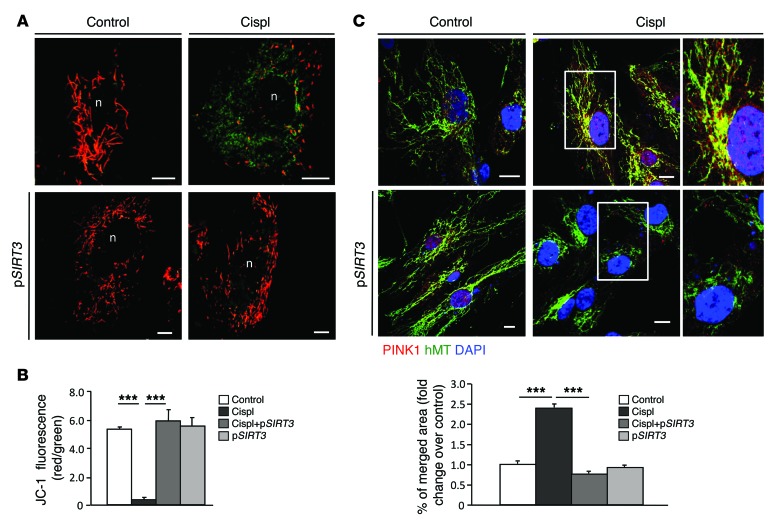
Figure 7. SIRT3 preserves mitochondrial integrity by limiting mitochondrial membrane depolarization and PINK1-related mitophagy in response to cisplatin.
(A) Mitochondrial membrane potential visualized by JC-1, a dye sensitive to mitochondrial Δψm changes. Depending on JC-1 distribution, the emission spectrum of the dye shifts from green (cytoplasmic) to red (mitochondrial) in control or cisplatin-treated RPTECs untransfected (top) or transfected with pSIRT3 (bottom). (B) Quantification of JC-1 fluorescence intensity (red/green florescent area). Scale bars: 10 μm. ***P < 0.001 using ANOVA corrected with Bonferroni coefficient. Values are mean ± SEM (n = 3 experiments). (C) Representative images of PINK1 distribution in control or cisplatin-treated RPTECs untransfected (top) or transfected with pSIRT3 (bottom) and costained with anti–human mitochondria antibody (hMT). Insets display the mitochondrial localization of PINK1 in enlarged images. Nuclei were counterstained with DAPI (blue). Scale bars: 10 μm. Quantification of merged fluorescence (yellow) of PINK1- (red) and hMT-positive mitochondrial staining (green) expressed as fold changes over control. ***P < 0.001, ANOVA corrected with Bonferroni coefficient. Values are mean ± SEM (n = 3 experiments).

