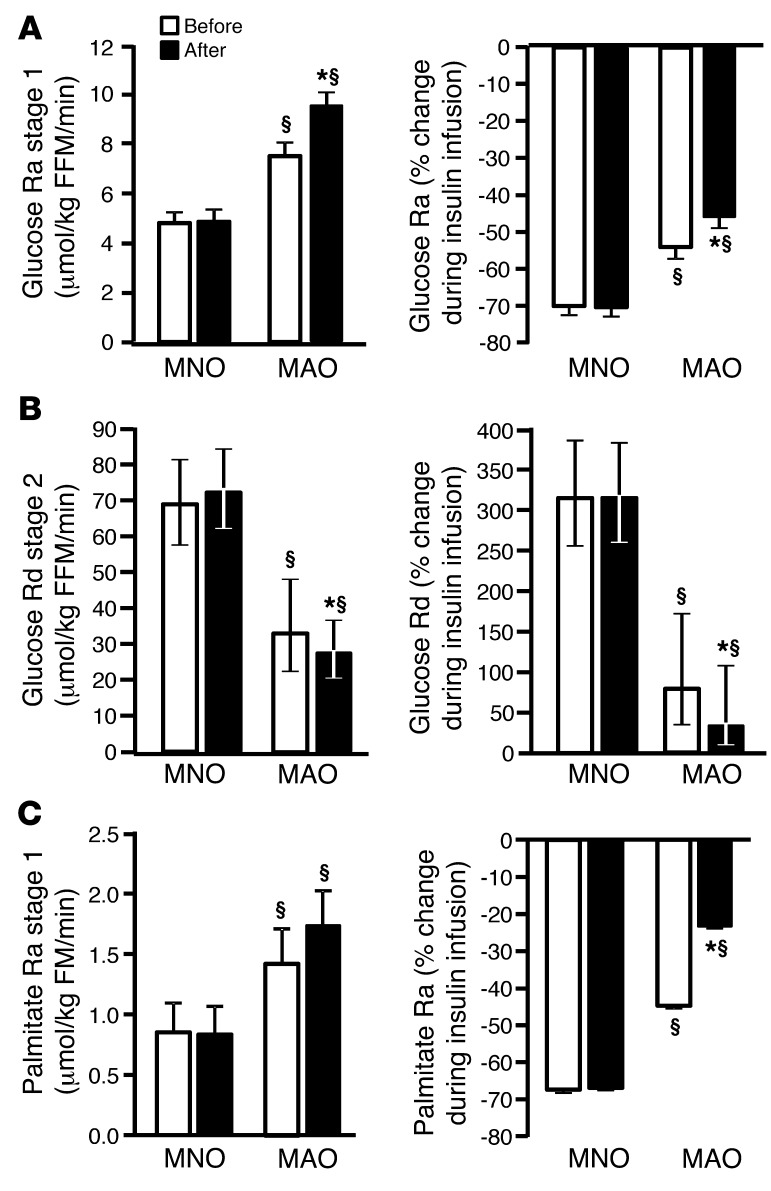
Figure 1. Hepatic, skeletal muscle, and adipose tissue insulin sensitivity.
(A) Hepatic, skeletal muscle, and adipose tissue insulin sensitivity in MNO (n = 12) and MAO (n = 8) subjects before (white bars) and after (black bars) weight gain. Endogenous glucose Ra in plasma and percentage of suppression of glucose Ra during low-dose insulin infusion (stage 1) of the clamp procedure (an index of hepatic insulin sensitivity). (B) Skeletal muscle glucose Rd from plasma and percentage of stimulation of glucose Rd during high-dose insulin infusion (stage 2) of the clamp procedure (an index of skeletal muscle insulin sensitivity). (C) Palmitate Ra in plasma and percentage of suppression of palmitate Ra during low-dose insulin infusion (stage 1) of the clamp procedure (an index of adipose tissue insulin sensitivity). Repeated-measures ANCOVA was used for statistical analysis, with the intervention as the within-subjects factor (before vs. after weight gain), the group as the between-subjects factor (MNO vs. MAO), and sex and race as covariates. §P < 0.01, value different from the corresponding MNO value; *P < 0.05, value different from the before–weight-gain value. Data represent the mean ± SEM (A and C) or the mean and 95% CIs (B).

