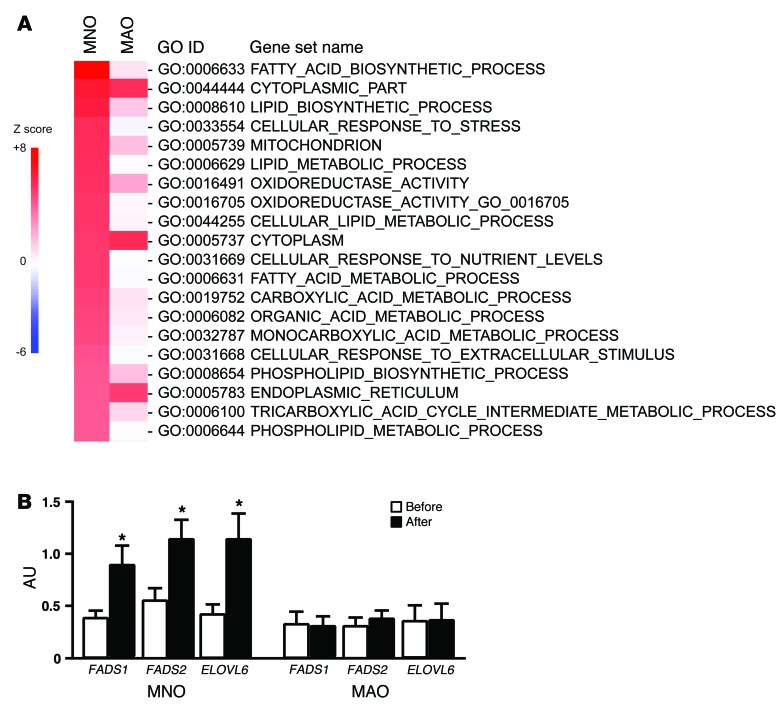
Figure 3. Adipose tissue gene expression profile.
PAGE was performed on microarray data to identify pathways in s.c. adipose tissue that changed with weight gain in MNO (n = 12) and MAO (n = 8) subjects. (A) The top-20 significantly upregulated pathways in MNO subjects are listed on the basis of their Z scores values before and after weight gain. (B) Gene expression of key lipogenic enzymes in s.c. adipose tissue was determined by real-time PCR in MNO and MAO subjects before (white bars) and after (black bars) weight gain. ANCOVA was used for statistical analysis, with the intervention as the within-subjects factor (before vs. after weight gain), the group as the between-subjects factor (MNO vs. MAO), and sex and race as covariates. *P < 0.02, value different from the before–weight-gain value. Data represent the mean ± SEM.

