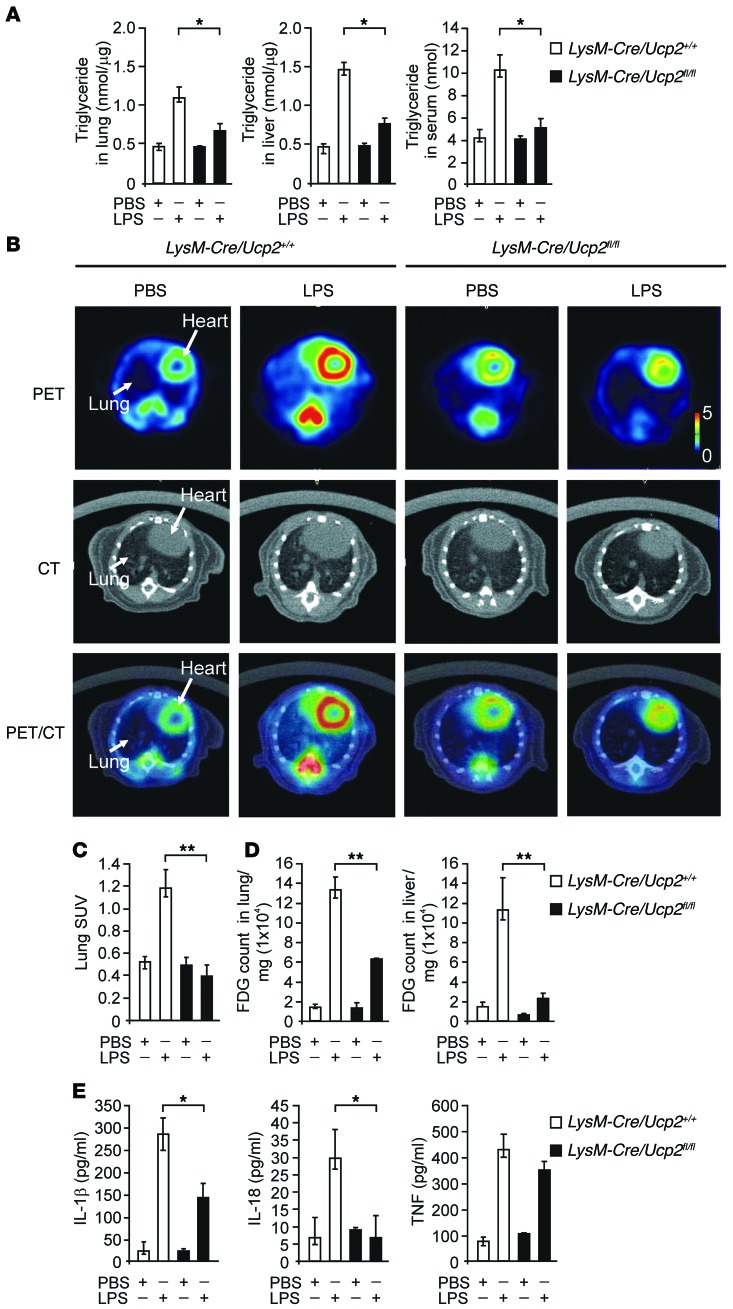
Figure 2. Deficiency of UCP2 inhibits lipid production through glucose uptake in vivo.
(A) TG production in the lungs, livers, and sera from LysM-Cre/Ucp2+/+ or LysM-Cre/Ucp2fl/fl mice after injection of LPS for 4 hours (10 mg/kg, i.p.). n = 3 per group, *P < 0.05, ANOVA. (B) Transverse SUV of PET/CT imaging using 18F-FDG of lungs from LysM-Cre/Ucp2+/+ or LysM-Cre/Ucp2fl/fl mice after injection of LPS for 4 hours (10 mg/kg, i.p.). Representative image of 3 independent experiments. Original magnification, ×2. (C) Quantification of transverse SUV in PET/CT imaging from B. n = 3 per group, **P < 0.01, ANOVA. (D) Ex vivo γ-ray counting using 18F-FDG of lungs and livers from LysM-Cre/Ucp2+/+ or LysM-Cre/Ucp2fl/fl mice after injection of LPS (10 mg/kg, i.p.) for 4 hours. n = 3 per group, **P < 0.01 ANOVA. (E) Luminex assay and ELISA assay for IL-1β, IL-18, and TNF secretion in the serum from B and D. n = 6 per group, *P < 0.05, ANOVA.

