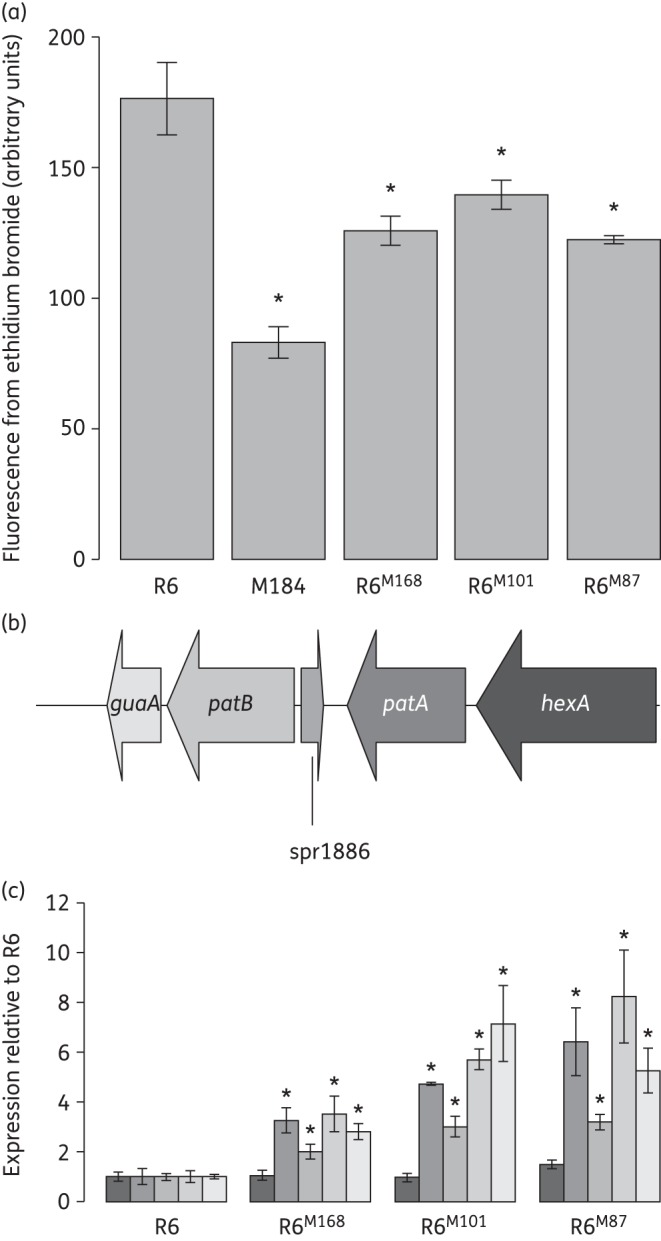
Figure 1.

Confirmation of patAB overexpression phenotype in transformants R6M168, R6M101 and R6M87. (a) Fluorescence due to intracellular accumulation of ethidium bromide following 10 min of incubation with 100 μM ethidium bromide. Bars and error bars represent averages and standard deviations of three biological replicates. *Accumulation significantly lower than R6; P < 0.05, one-tailed Student's t-test. A previously described strain, M184, was used as a positive control. (b) Representation of the patAB genetic locus. (c) Expression of patA, patB and neighbouring genes in R6 and transformants R6M168, R6M101 and R6M87 measured by qRT–PCR compared with rpoB. Bars represent average expressions relative to R6 from three biological replicates and are shaded by gene as in panel (b). Error bars represent standard deviations of three biological replicates. *Expression significantly different from R6; P < 0.05, two-tailed Student's t-test.
