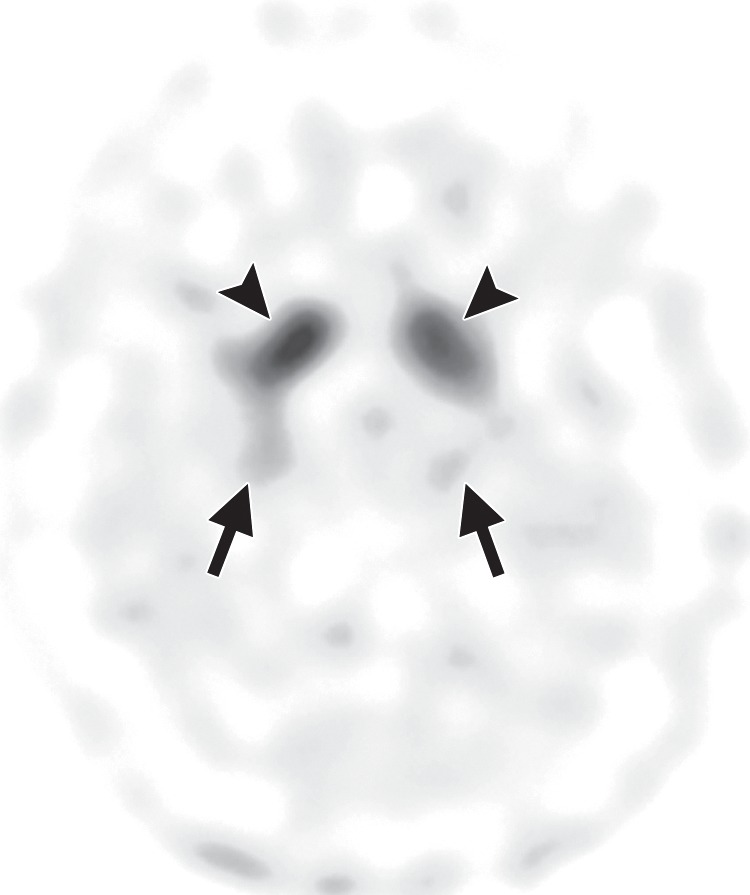
Figure 6h.

Cerebellar dominant type MSA. (a, b) Axial FLAIR MR images demonstrate marked focal atrophy of the midbrain and both middle cerebral peduncles (arrows in a) with ex vacuo dilatation of the fourth ventricle, as well as subtle cruciform T2 hyperintensity in the pons (hot cross bun sign) (arrow in b). (c, d) Axial FDG PET images demonstrate cerebellar hypometabolism (arrows in c). (e) Amyloid PET image shows normal findings. (f, g) Semiquantitative 3D SSP FDG PET images (f ) and Z-score images (g) obtained for quantitative cortical analysis demonstrate cerebellar hypometabolism (arrows in g), thereby confirming the findings seen at axial FDG PET. (h) 123I ioflupane SPECT image shows bilateral loss of putaminal activity (arrows) and symmetric decreased activity in the caudate nuclei (arrowheads).
