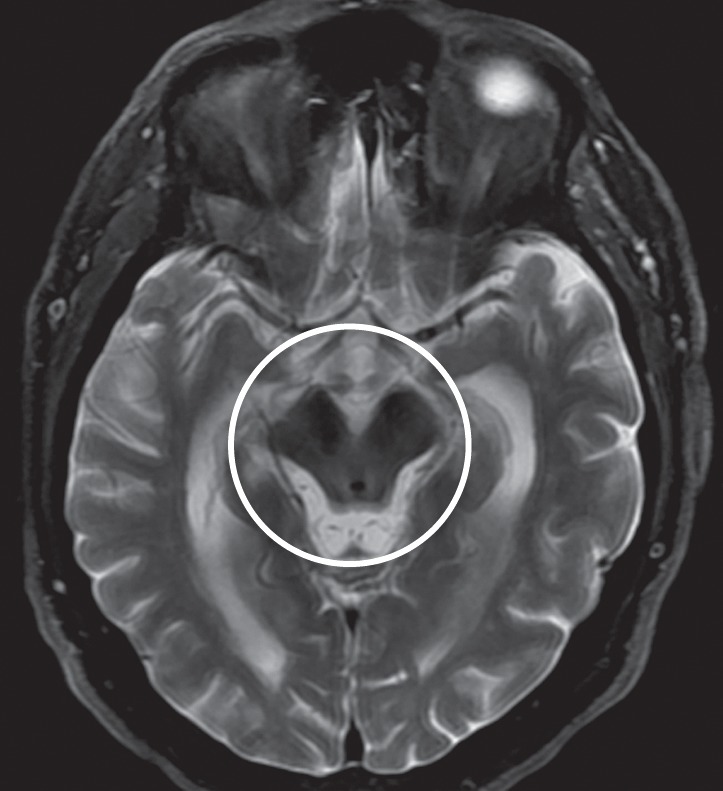
Figure 7a.

PSP. (a) Axial fast spin-echo T2-weighted MR image demonstrates the Mickey Mouse sign (circle), created by selective midbrain atrophy with relative preservation of the cerebral peduncles and tectum. (b) Midsagittal T1-weighted MR image demonstrates the hummingbird sign (oval), created by selective atrophy of the midbrain tegmentum with relative pontine preservation. (c, d) Axial FDG PET images show hypometabolism in the posterior frontal lobes and basal ganglia, worse on the right side (arrow in c). (e) Amyloid PET image shows normal findings. (f–h) Semiquantitative 3D SSP FDG PET images (f) and Z-score images (g, h) obtained for quantitative analysis show posterior frontal lobe hypometabolism (arrows in g), best seen on the superior view (oval in h). (i) 123I ioflupane SPECT image shows decreased bilateral putaminal dopaminergic activity, more notably on the right side (arrow).
