
Figure 8f.
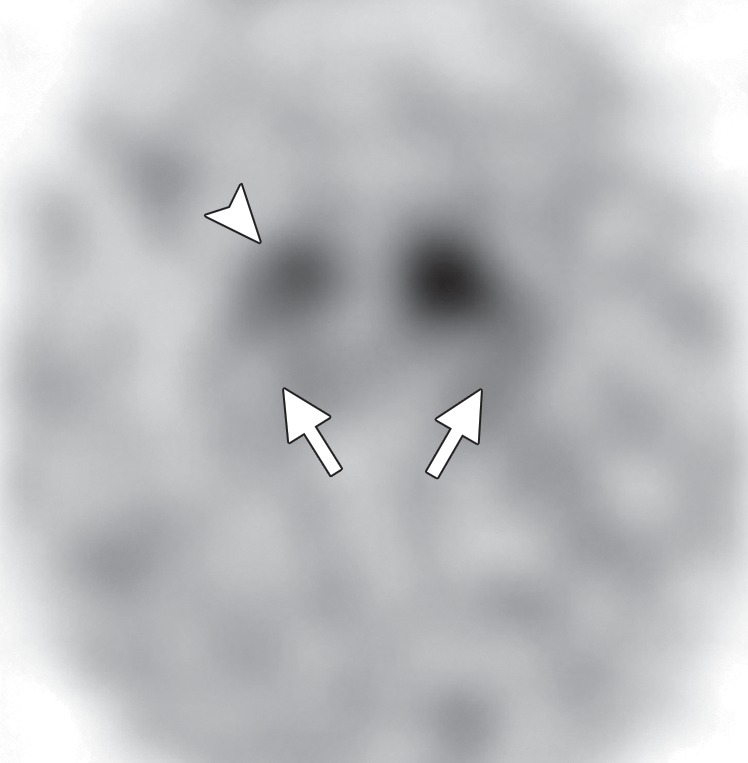
DLB. (a) Axial FLAIR MR image reveals moderate diffuse cerebral volume loss without focal atrophy. (b) Axial FDG PET image shows diffuse cortical hypometabolism, more marked in the occipital lobes (ovals). (c) Amyloid PET image shows diffuse cortical deposition. (d, e) Semiquantitative 3D SSP FDG PET images (d) and Z-score images (e) obtained for quantitative analysis demonstrate prominent occipital hypometabolism (arrows in e). (f ) 123I ioflupane SPECT image reveals bilateral absence of putaminal activity (arrows) and asymmetrically decreased activity in the right caudate nucleus (arrowhead).