
Figure 9a.
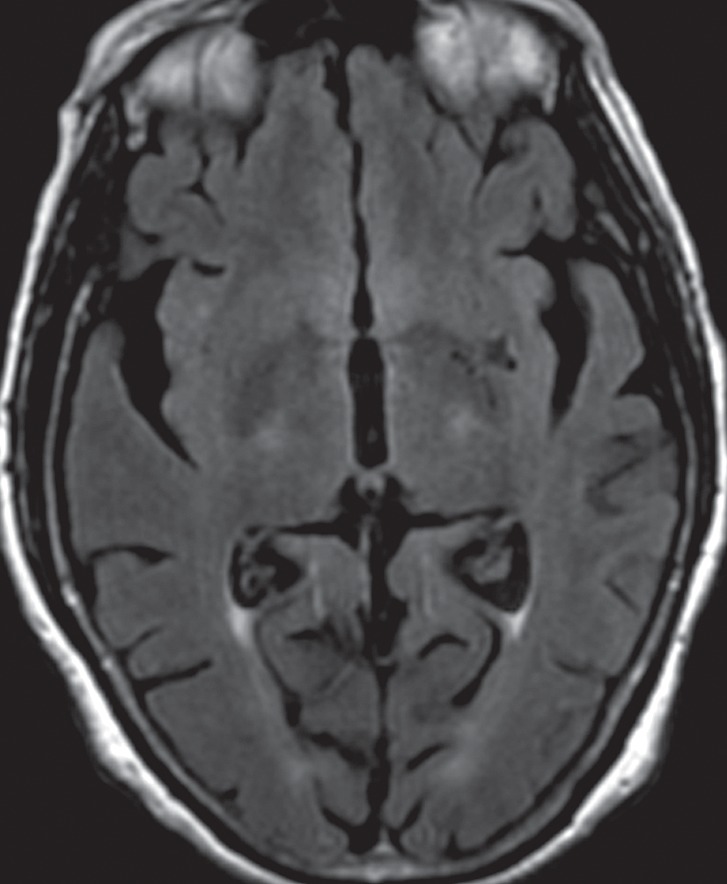
CBD. (a, b) Axial FLAIR MR images show structurally intact basal ganglia and focal left parietal lobe atrophy (oval in b). (c) Amyloid PET image shows normal findings. (d, e) Axial FDG PET images show preserved basal ganglia activity and left parietal hypometabolism (oval in e). (f) 123I ioflupane SPECT image shows decreased activity in the left putamen (arrow). (g–i) Semiquantitative 3D SSP FDG PET images (g) and Z-score images (h, i) demonstrate isolated left parietal hypometabolism, most evident on the superior view (oval in i).